Advance Auto Parts 2013 Annual Report Download - page 40
Download and view the complete annual report
Please find page 40 of the 2013 Advance Auto Parts annual report below. You can navigate through the pages in the report by either clicking on the pages listed below, or by using the keyword search tool below to find specific information within the annual report.-
 1
1 -
2
-
3
-
4
-
5
-
6
-
7
-
8
-
9
-
10
-
11
-
12
-
13
-
14
-
15
-
16
-
17
-
18
-
19
-
20
-
21
-
22
-
23
-
24
-
25
-
26
-
27
-
28
-
29
-
 30
30 -
 31
31 -
 32
32 -
 33
33 -
 34
34 -
 35
35 -
 36
36 -
 37
37 -
 38
38 -
 39
39 -
 40
40 -
 41
41 -
 42
42 -
 43
43 -
 44
44 -
 45
45 -
 46
46 -
 47
47 -
 48
48 -
 49
49 -
 50
50 -
51
-
52
-
53
-
54
-
55
-
56
-
57
-
58
-
59
-
60
-
61
-
62
-
63
-
64
-
65
-
66
-
67
-
68
-
69
-
70
-
71
-
72
-
73
-
74
-
75
-
76
-
77
-
78
-
79
-
80
-
81
-
82
-
83
-
84
-
85
-
86
-
87
-
88
-
89
-
90
-
91
-
92
-
93
-
94
-
95
-
96
-
97
-
98
-
99
-
100
-
101
-
102
-
103
-
104
-
105
-
106
-
107
-
108
 |
 |

27
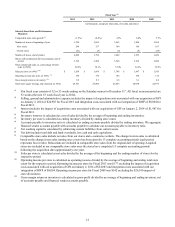
Gross Profit
Gross profit for Fiscal 2013 was $3,252.1 million, or 50.1% of net sales, as compared to $3,098.0 million, or 49.9% of net
sales, in Fiscal 2012, an increase of 15 basis points. The increase in gross profit as a percentage of net sales was driven by
increased merchandise margins, due to lower acquisition costs and a favorable product mix, and improvement in shrink
partially offset by planned inefficiencies in supply chain costs associated with the ramp-up in shipments of inventory from our
new distribution center and the impact from a higher mix of Commercial sales which have a lower gross profit rate. The
increase in our Commercial mix of sales was primarily due to the sales from the acquired BWP stores.
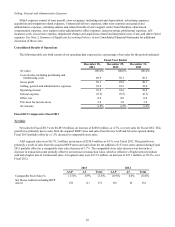
SG&A Expenses
SG&A expenses for Fiscal 2013 were $2,591.8 million, or 39.9% of net sales, as compared to $2,440.7 million, or 39.3%
of net sales, for Fiscal 2012, an increase of 58 basis points. Included in SG&A expenses in Fiscal 2013 were $25.0 million, or
38 basis points, of transaction expenses associated with our acquisition of GPI and $8.0 million, or 12 basis points, of expenses
associated with our integration of BWP. Other primary drivers of the net increase in SG&A expenses, as a percentage of net
sales, include costs associated with increased new store openings and higher incentive compensation, partially offset by lower
marketing expense and a decrease in overall administrative and support costs.
Operating Income
Operating income for Fiscal 2013 was $660.3 million, representing 10.2% of net sales, as compared to $657.3 million, or
10.6% of net sales, for Fiscal 2012, a decrease of 42 basis points. This decrease was due to a higher SG&A rate partially offset
by a higher gross profit rate.
AAP generated operating income of $647.8 million, or 10.5% of net sales, for Fiscal 2013 as compared to $648.5 million,
or 11.0% of net sales, for Fiscal 2012. This decrease on a rate basis was due to the gross profit and SG&A drivers previously
discussed. AI generated operating income for Fiscal 2013 of $12.5 million as compared to $8.8 million for Fiscal 2012. The
increase in AI’s operating income was primarily due to improvements in store labor productivity and SG&A leverage driven by
lower administrative and support costs.
Interest Expense
Interest expense for Fiscal 2013 was $36.6 million, or 0.6% of net sales, as compared to $33.8 million, or 0.5% of net
sales, in Fiscal 2012.
Income Taxes
Income tax expense for Fiscal 2013 was $234.6 million, as compared to $236.4 million for Fiscal 2012. Our effective
income tax rate was 37.5% and 37.9% for Fiscal 2013 and Fiscal 2012, respectively.
Net Income
Net income was $391.8 million, or $5.32 per diluted share, for Fiscal 2013 as compared to $387.7 million, or $5.22 per
diluted share, for Fiscal 2012. As a percentage of net sales, net income for Fiscal 2013 was 6.0%, as compared to 6.2% for
Fiscal 2012. The increase in diluted EPS was driven primarily by the increase in net income.
Fiscal 2012 Compared to Fiscal 2011
Net Sales
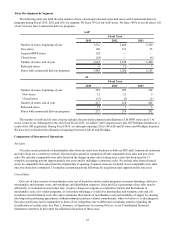
Net sales for Fiscal 2012 were $6,205.0 million, an increase of $34.5 million, or 0.6%, over net sales for Fiscal 2011. This
growth was primarily due to sales from AAP and AI stores added within Fiscal 2012 partially offset by a decrease in
comparable store sales.
AAP segment sales were $5,914.9 million, an increase of $30.0 million, or 0.5%, over Fiscal 2011. This growth was
primarily a result of sales from the net addition of 116 new stores over Fiscal 2012 partially offset by a comparable store sales
decrease of (0.9)%. The comparable store sales decrease was driven by a decrease in transaction count partially offset by an
increase in transaction value despite more promotional activity in response to lower customer demand. The increase in
transaction value is primarily due to (i) the gradual increase in cost and complexity of automotive parts and commodity prices