Advance Auto Parts 2013 Annual Report Download - page 34
Download and view the complete annual report
Please find page 34 of the 2013 Advance Auto Parts annual report below. You can navigate through the pages in the report by either clicking on the pages listed below, or by using the keyword search tool below to find specific information within the annual report.-
 1
1 -
2
-
3
-
4
-
5
-
6
-
7
-
8
-
9
-
10
-
11
-
12
-
13
-
14
-
15
-
16
-
17
-
18
-
19
-
20
-
21
-
22
-
23
-
 24
24 -
 25
25 -
 26
26 -
 27
27 -
 28
28 -
 29
29 -
 30
30 -
 31
31 -
 32
32 -
 33
33 -
 34
34 -
 35
35 -
 36
36 -
 37
37 -
 38
38 -
 39
39 -
 40
40 -
 41
41 -
 42
42 -
 43
43 -
 44
44 -
45
-
46
-
47
-
48
-
49
-
50
-
51
-
52
-
53
-
54
-
55
-
56
-
57
-
58
-
59
-
60
-
61
-
62
-
63
-
64
-
65
-
66
-
67
-
68
-
69
-
70
-
71
-
72
-
73
-
74
-
75
-
76
-
77
-
78
-
79
-
80
-
81
-
82
-
83
-
84
-
85
-
86
-
87
-
88
-
89
-
90
-
91
-
92
-
93
-
94
-
95
-
96
-
97
-
98
-
99
-
100
-
101
-
102
-
103
-
104
-
105
-
106
-
107
-
108
 |
 |

21
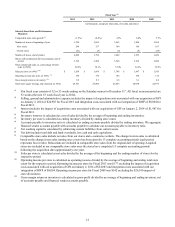
Fiscal Year (1)
2013 2012 2011 2010 2009
(in thousands, except per share data, store data and ratios)
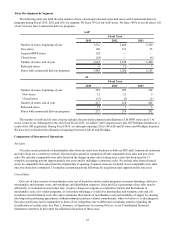
Selected Store Data and Performance
Measures:
Comparable store sales growth (9) (1.5%) (0.8%) 2.2% 8.0% 5.3%
Number of stores at beginning of year 3,794 3,662 3,563 3,420 3,368
New stores 296 137 104 148 107
Closed stores (41) (5) (5) (5) (55)
Number of stores, end of period 4,049 3,794 3,662 3,563 3,420
Stores with commercial delivery program, end of
period 3,702 3,484 3,326 3,212 3,024
Total commercial sales, as a percentage of total
sales (in 000s) 40.4% 38.1% 37.0% 34.2% 32.0%
Sales per store (in 000s) (10) $ 1,656 $ 1,664 $ 1,708 $ 1,697 $ 1,595
Operating income per store (in 000s) (11) 168 176 184 168 134
Gross margin return on inventory (12) 9.9 9.3 6.6 5.1 4.0
Total store square footage, end of period (in 000s) 29,701 27,806 26,663 25,950 24,973
(1) Our fiscal year consists of 52 or 53 weeks ending on the Saturday nearest to December 31st. All fiscal years presented are
52 weeks (the next 53 week fiscal year is 2014).
(2) Selling, general and administrative expense includes the impact of acquisition costs associated with our acquisition of GPI
on January 2, 2014 of $24,983 for Fiscal 2013 and integration costs associated with our integration of BWP of $8,004 for
Fiscal 2013.
(3) Interest includes the impact of acquisition costs associated with our acquisition of GPI on January 2, 2014 of $1,987 for
Fiscal 2013.
(4) Inventory turnover is calculated as cost of sales divided by the average of beginning and ending inventories.
(5) Inventory per store is calculated as ending inventory divided by ending store count.
(6) Accounts payable to inventory ratio is calculated as ending accounts payable divided by ending inventory. We aggregate
financed vendor accounts payable with accounts payable to calculate our accounts payable to inventory ratio.
(7) Net working capital is calculated by subtracting current liabilities from current assets.
(8) Net debt includes total debt and bank overdrafts, less cash and cash equivalents.
(9) Comparable store sales include net sales from our stores and e-commerce website. The change in store sales is calculated
based on the change in net sales starting once a store has been open for 13 complete accounting periods (each period
represents four weeks). Relocations are included in comparable store sales from the original date of opening. Acquired
stores are included in our comparable store sales once the stores have completed 13 complete accounting periods
following the acquisition date (approximately one year).
(10) Sales per store is calculated as net sales divided by the average of the beginning and the ending number of stores for the
respective period.
(11) Operating income per store is calculated as operating income divided by the average of beginning and ending total store
count for the respective period. Operating income per store for Fiscal 2013 was $177 excluding the impact of acquisition
costs associated with our acquisition of GPI on January 2, 2014 of $24,983 and integration costs associated with our
integration of BWP of $8,004. Operating income per store for Fiscal 2009 was $142 excluding the $26,100 impact of
store divestitures.
(12) Gross margin return on inventory is calculated as gross profit divided by an average of beginning and ending inventory, net
of accounts payable and financed vendor accounts payable.