Advance Auto Parts 2013 Annual Report Download - page 43
Download and view the complete annual report
Please find page 43 of the 2013 Advance Auto Parts annual report below. You can navigate through the pages in the report by either clicking on the pages listed below, or by using the keyword search tool below to find specific information within the annual report.-
 1
1 -
2
-
3
-
4
-
5
-
6
-
7
-
8
-
9
-
10
-
11
-
12
-
13
-
14
-
15
-
16
-
17
-
18
-
19
-
20
-
21
-
22
-
23
-
24
-
25
-
26
-
27
-
28
-
29
-
30
-
31
-
32
-
 33
33 -
 34
34 -
 35
35 -
 36
36 -
 37
37 -
 38
38 -
 39
39 -
 40
40 -
 41
41 -
 42
42 -
 43
43 -
 44
44 -
 45
45 -
 46
46 -
 47
47 -
 48
48 -
 49
49 -
 50
50 -
 51
51 -
 52
52 -
 53
53 -
54
-
55
-
56
-
57
-
58
-
59
-
60
-
61
-
62
-
63
-
64
-
65
-
66
-
67
-
68
-
69
-
70
-
71
-
72
-
73
-
74
-
75
-
76
-
77
-
78
-
79
-
80
-
81
-
82
-
83
-
84
-
85
-
86
-
87
-
88
-
89
-
90
-
91
-
92
-
93
-
94
-
95
-
96
-
97
-
98
-
99
-
100
-
101
-
102
-
103
-
104
-
105
-
106
-
107
-
108
 |
 |

30
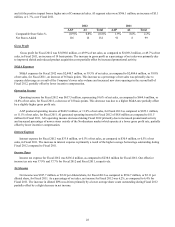
2014, we anticipate that our capital expenditures will be approximately $325 million - $350 million. These investments will be
primarily driven by new store development (leased and owned locations), investments in our existing stores and investments
under our Superior Availability and Service Leadership strategies, including continued investments in our supply chain network
and new systems. We anticipate opening between 120 to 140 AAP stores and AI stores and Worldpac branches during Fiscal
2014. We have not yet finalized the allocation of openings between AAP, AI and Worldpac.
Stock Repurchase Program
Our stock repurchase program allows us to repurchase our common stock on the open market or in privately negotiated
transactions from time to time in accordance with the requirements of the SEC.
During Fiscal 2013, we repurchased 1.0 million shares of our common stock at an aggregate cost of $77.3 million, or an
average price of $77.47 per share. As of December 28, 2013, we had $415.1 million remaining under our $500 million stock
repurchase program authorized by our Board of Directors on May 14, 2012. Additionally, during Fiscal 2013, we repurchased
38,000 shares of our common stock at an aggregate cost of $3.5 million, or an average price of $91.78 per share, in connection
with the net settlement of shares issued as a result of the vesting of restricted stock.
Dividend
Since Fiscal 2006, our Board of Directors has declared quarterly dividends of $0.06 per share to stockholders of record. On
February 5, 2014, our Board of Directors declared a quarterly dividend of $0.06 per share to be paid on April 4, 2014 to all
common stockholders of record as of March 21, 2014.
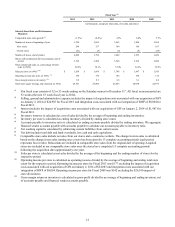
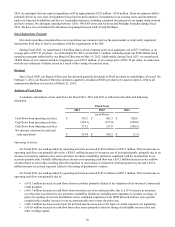
Analysis of Cash Flows
A summary and analysis of our cash flows for Fiscal 2013, 2012 and 2011 is reflected in the table and following
discussion.
Fiscal Year
2013 2012 2011
(in millions)
Cash flows from operating activities $ 545.3 $ 685.3 $ 828.8
Cash flows from investing activities (362.1)(273.0)(290.0)
Cash flows from financing activities 331.2 127.9 (540.2)
Net increase (decrease) in cash and
cash equivalents $ 514.4 $ 540.2 $ (1.3)
Operating Activities
For Fiscal 2013, net cash provided by operating activities decreased $140.0 million to $545.3 million. This net decrease in
operating cash flow was primarily driven by a $206.3 million increase in inventory, net of accounts payable, primarily due to an
increase in inventory related to new stores and other inventory availability initiatives combined with the deceleration in our
accounts payable ratio. Partially offsetting these decreases in operating cash flow was a $57.1 million decrease in the outflow
of cash related to receivables resulting from the transition of our in-house Commercial credit program last year and a $22.4
million increase in accrued expenses related to the timing of payments to vendors.
For Fiscal 2012, net cash provided by operating activities decreased $143.6 million to $685.3 million. This net decrease in
operating cash flow was primarily due to:
• a $74.1 million decrease in cash flows from receivables primarily related to the transition of our in-house Commercial
credit program;
• a $65.1 million decrease in cash flows from inventory, net of accounts payable, due to a 13% increase in inventory
over the prior year driven by our inventory availability initiatives, including store upgrades to a greater coverage of
parts, the opening of our new distribution center, continued expansion of our HUB network and new store growth,
coupled with a smaller increase in our accounts payable ratio versus the prior year;
• a $26.1 million decrease in provision for deferred income taxes due to the lapse of certain corporate tax legislation;
• a $14.9 million decrease in cash flow from other assets primarily related to timing of refundable income taxes and
other working capital;