Advance Auto Parts 2013 Annual Report Download - page 42
Download and view the complete annual report
Please find page 42 of the 2013 Advance Auto Parts annual report below. You can navigate through the pages in the report by either clicking on the pages listed below, or by using the keyword search tool below to find specific information within the annual report.-
 1
1 -
2
-
3
-
4
-
5
-
6
-
7
-
8
-
9
-
10
-
11
-
12
-
13
-
14
-
15
-
16
-
17
-
18
-
19
-
20
-
21
-
22
-
23
-
24
-
25
-
26
-
27
-
28
-
29
-
30
-
31
-
 32
32 -
 33
33 -
 34
34 -
 35
35 -
 36
36 -
 37
37 -
 38
38 -
 39
39 -
 40
40 -
 41
41 -
 42
42 -
 43
43 -
 44
44 -
 45
45 -
 46
46 -
 47
47 -
 48
48 -
 49
49 -
 50
50 -
 51
51 -
 52
52 -
53
-
54
-
55
-
56
-
57
-
58
-
59
-
60
-
61
-
62
-
63
-
64
-
65
-
66
-
67
-
68
-
69
-
70
-
71
-
72
-
73
-
74
-
75
-
76
-
77
-
78
-
79
-
80
-
81
-
82
-
83
-
84
-
85
-
86
-
87
-
88
-
89
-
90
-
91
-
92
-
93
-
94
-
95
-
96
-
97
-
98
-
99
-
100
-
101
-
102
-
103
-
104
-
105
-
106
-
107
-
108
 |
 |

29
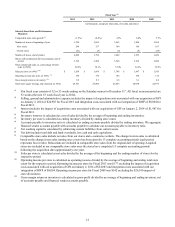
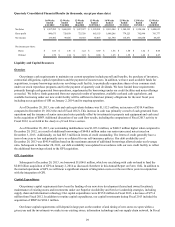
Quarterly Consolidated Financial Results (in thousands, except per share data)
16-Weeks
Ended
4/21/2012
12-Weeks
Ended
7/14/2012
12-Weeks
Ended
10/6/2012
12-Weeks
Ended
12/29/2012
16-Weeks
Ended
4/20/2013
12-Weeks
Ended
7/13/2013
12-Weeks
Ended
10/5/2013
12-Weeks
Ended
12/28/2013
Net Sales $ 1,957,292 $ 1,460,983 $ 1,457,527 $ 1,329,201 $ 2,015,304 $ 1,549,553 $ 1,520,144 $ 1,408,813
Gross profit 980,673 728,858 725,350 663,155 1,008,206 779,223 762,940 701,777
Net income 133,506 99,606 89,503 65,055 121,790 116,871 103,830 49,267
Net income per share:
Basic $ 1.83 $ 1.36 $ 1.22 $ 0.89 $ 1.66 $ 1.60 $ 1.42 $ 0.68
Diluted $ 1.79 $ 1.34 $ 1.21 $ 0.88 $ 1.65 $ 1.59 $ 1.42 $ 0.67
Liquidity and Capital Resources
Overview
Our primary cash requirements to maintain our current operations include payroll and benefits, the purchase of inventory,
contractual obligations, capital expenditures and the payment of income taxes. In addition, we have used available funds for
acquisitions, to repay borrowings under our revolving credit facility, to periodically repurchase shares of our common stock
under our stock repurchase programs and for the payment of quarterly cash dividends. We have funded these requirements
primarily through cash generated from operations, supplemented by borrowings under our credit facilities and notes offerings
as needed. We believe funds generated from our expected results of operations, available cash and cash equivalents, and
available borrowing under our new credit facility will be sufficient to fund our primary obligations for the next fiscal year,
including our acquisition of GPI on January 2, 2014 and its ongoing operation.
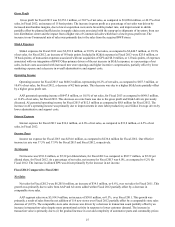
As of December 28, 2013, our cash and cash equivalents balance was $1,112.5 million, an increase of $514.4 million
compared to December 29, 2012 (the end of Fiscal 2012). This increase in cash was primarily a result of cash generated from
operations and the issuance of senior unsecured notes partially offset by investments in property and equipment and cash used
in the acquisition of BWP. Additional discussion of our cash flow results, including the comparison of Fiscal 2013 activity to
Fiscal 2012, is set forth in the Analysis of Cash Flows section.
As of December 28, 2013, our outstanding indebtedness was $1,053.6 million, or $448.5 million higher when compared to
December 29, 2012, as a result of additional borrowings of $448.6 million under our senior unsecured notes issued on
December 3, 2013. Additionally, we had $87.3 million in letters of credit outstanding. The letters of credit generally have a
term of one year or less and primarily serve as collateral for our self-insurance policies. Our debt availability as of
December 28, 2013 was $545.4 million based on the maximum amount of additional borrowings allowed under our leverage
ratio. Subsequent to December 28, 2013, our debt availability was updated in accordance with our new credit facility to reflect
the additional borrowings related to the GPI acquisition.
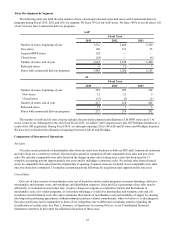
GPI Acquisition
Subsequent to December 28, 2013, we borrowed $1,006.0 million, which we used along with cash on-hand to fund the
$2.08 billion acquisition of GPI on January 2, 2014 as discussed elsewhere in this Annual Report on Form 10-K. In addition to
the normal operations of GPI, we will incur a significant amount of integration costs over the next three years in conjunction
with the integration of GPI.
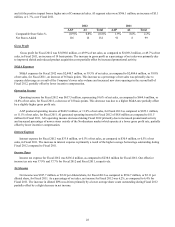
Capital Expenditures
Our primary capital requirements have been the funding of our new store development (leased and owned locations),
maintenance of existing stores and investments under our Superior Availability and Service Leadership strategies, including
supply chain and information technology. Our capital expenditures were $195.8 million in Fiscal 2013, a decrease of $75.4
million from Fiscal 2012. In addition to routine capital expenditures, our capital investments during Fiscal 2013 included the
acquisition of BWP for $186.1 million.
Our future capital requirements will depend in large part on the number of and timing of new stores we open within a
given year and the investments we make in our existing stores, information technology and our supply chain network. In Fiscal