Advance Auto Parts 2013 Annual Report Download - page 47
Download and view the complete annual report
Please find page 47 of the 2013 Advance Auto Parts annual report below. You can navigate through the pages in the report by either clicking on the pages listed below, or by using the keyword search tool below to find specific information within the annual report.-
 1
1 -
2
-
3
-
4
-
5
-
6
-
7
-
8
-
9
-
10
-
11
-
12
-
13
-
14
-
15
-
16
-
17
-
18
-
19
-
20
-
21
-
22
-
23
-
24
-
25
-
26
-
27
-
28
-
29
-
30
-
31
-
32
-
33
-
34
-
35
-
36
-
 37
37 -
 38
38 -
 39
39 -
 40
40 -
 41
41 -
 42
42 -
 43
43 -
 44
44 -
 45
45 -
 46
46 -
 47
47 -
 48
48 -
 49
49 -
 50
50 -
 51
51 -
 52
52 -
 53
53 -
 54
54 -
 55
55 -
 56
56 -
 57
57 -
58
-
59
-
60
-
61
-
62
-
63
-
64
-
65
-
66
-
67
-
68
-
69
-
70
-
71
-
72
-
73
-
74
-
75
-
76
-
77
-
78
-
79
-
80
-
81
-
82
-
83
-
84
-
85
-
86
-
87
-
88
-
89
-
90
-
91
-
92
-
93
-
94
-
95
-
96
-
97
-
98
-
99
-
100
-
101
-
102
-
103
-
104
-
105
-
106
-
107
-
108
 |
 |
34
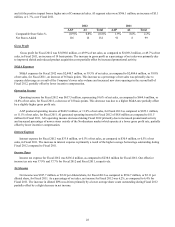
not have minimum purchase commitments under our vendor supply agreements nor are our open purchase orders
binding agreements. Accordingly, we have excluded open purchase orders from the above table.
Critical Accounting Policies
Our financial statements have been prepared in accordance with accounting policies generally accepted in the United
States of America. Our discussion and analysis of the financial condition and results of operations are based on these financial
statements. The preparation of these financial statements requires the application of accounting policies in addition to certain
estimates and judgments by our management. Our estimates and judgments are based on currently available information,
historical results and other assumptions we believe are reasonable. Actual results could differ materially from these estimates.
The preparation of our financial statements included the following significant estimates and exercise of judgment.
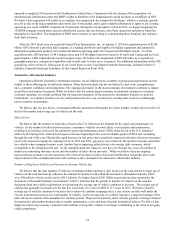
Vendor Incentives
We receive incentives in the form of reductions to amounts owed and/or payments from vendors related to cooperative
advertising allowances, volume rebates and other promotional considerations. Many of these incentives are under long-term
agreements (terms in excess of one year), while others are negotiated on an annual basis or less (short-term). Volume rebates
and cooperative advertising allowances not offsetting in SG&A are earned based on inventory purchases and initially recorded
as a reduction to inventory. These deferred amounts are included as a reduction to cost of sales as the inventory is sold.
Cooperative advertising allowances provided as a reimbursement of specific, incremental and identifiable costs incurred to
promote a vendor’s products are included as an offset to SG&A when the cost is incurred. Certain of our vendor agreements
contain purchase volume incentives that provide for increased funding when graduated purchase volumes are met. Amounts
accrued throughout the year could be impacted if actual purchase volumes differ from projected annual purchase volumes.
Total deferred vendor incentives included in inventory was $111.3 million and $103.0 million as of December 28, 2013 and
December 29, 2012, respectively.
Similarly, we recognize other promotional incentives earned under long-term agreements as a reduction to cost of sales.
However, these incentives are recognized based on the cumulative net purchases as a percentage of total estimated net
purchases over the life of the agreement. Short-term incentives (terms less than one year) are generally recognized as a
reduction to cost of sales over the duration of any short-term agreements.
Amounts received or receivable from vendors that are not yet earned are reflected as deferred revenue. Management’s
estimate of the portion of deferred revenue that will be realized within one year of the balance sheet date is included in Other
current liabilities. Earned amounts that are receivable from vendors are included in Receivables, net except for that portion
expected to be received after one year, which is included in Other assets, net. We regularly review the receivables from vendors
to ensure they are able to meet their obligations. Historically, the change in our reserve for receivables related to vendor
funding has not been significant. A 10% difference in our vendor incentives deferred in inventory at December 28, 2013 would
have affected net income by approximately $7.0 million for the fiscal year ended December 28, 2013.
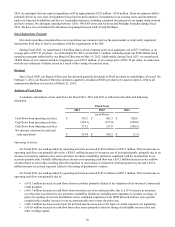
Inventory Reserves
Our inventory reserves consist of reserves for projected losses related to shrink and for potentially excess and obsolete
inventory. An increase to our inventory reserves is recorded as an increase to our cost of sales. Conversely, a decrease to our
inventory reserves is recorded as a decrease to our cost of sales. Our inventory reserves for Fiscal 2013, 2012 and 2011 were
$37.5 million, $31.4 million and $30.8 million, respectively.
Shrink may occur due to theft, loss or inaccurate records for the receipt of merchandise, among other things. We establish
reserves for estimated store shrink at a point in time based on results of physical inventories conducted by independent third
parties in substantially all our stores over the course of the year, results from other targeted inventory counts in our stores and
historical and current loss trends. In our distribution facilities, we perform cycle counts throughout the year to measure actual
shrink and to estimate reserve requirements. We believe we have sufficient current and historical knowledge to record
reasonable estimates for our shrink reserve and that any differences in our shrink rate in the future would not have a material
impact on our shrink reserve.
Our shrink rate has fluctuated less than 10 basis points over the last two years. Historically, we have not experienced
material adjustments to our shrink reserve. Furthermore, we have consistently completed a similar number of physical
inventories at comparable times throughout the year.