Advance Auto Parts 2013 Annual Report Download - page 3
Download and view the complete annual report
Please find page 3 of the 2013 Advance Auto Parts annual report below. You can navigate through the pages in the report by either clicking on the pages listed below, or by using the keyword search tool below to find specific information within the annual report.
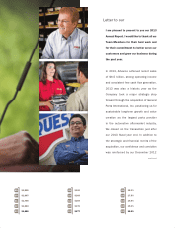
I am pleased to present to you our 2013
Annual Report. I would like to thank all our
Team Members for their hard work and
for their commitment to better serve our
customers and grow our business during
the past year.
In 2013, Advance achieved record sales
of $6.5 billion, strong operating income
and consistent free cash ow generation.
2013 was also a historic year as the
Company took a major strategic step
forward through the acquisition of General
Parts International, Inc. positioning us for
sustainable long-term growth and value
creation as the largest parts provider
in the automotive aftermarket industry.
We closed on the transaction just after
our 2013 scal year end. In addition to
the strategic and nancial merits of the
acquisition, our condence and conviction
was reinforced by our December 2012
continued
Letter to our STOCKHOLDERS
Performance Measures(2)
Sales per Store (in thousands) Operating Income per Store (in thousands) Return on Invested Capital %(3)
$1,595 $142 15.1%
$1,697 $168 17.5%
$1,708 $184 19.5%
$1,664 $176 19.4%
$1,656 $177 19.0%
09 09 09
10 10 10
11 11 11
12 12 12
13 13 13
*See next page for footnotes.

