Advance Auto Parts 2013 Annual Report Download - page 59
Download and view the complete annual report
Please find page 59 of the 2013 Advance Auto Parts annual report below. You can navigate through the pages in the report by either clicking on the pages listed below, or by using the keyword search tool below to find specific information within the annual report.-
 1
1 -
2
-
3
-
4
-
5
-
6
-
7
-
8
-
9
-
10
-
11
-
12
-
13
-
14
-
15
-
16
-
17
-
18
-
19
-
20
-
21
-
22
-
23
-
24
-
25
-
26
-
27
-
28
-
29
-
30
-
31
-
32
-
33
-
34
-
35
-
36
-
37
-
38
-
39
-
40
-
41
-
42
-
43
-
44
-
45
-
46
-
47
-
48
-
 49
49 -
 50
50 -
 51
51 -
 52
52 -
 53
53 -
 54
54 -
 55
55 -
 56
56 -
 57
57 -
 58
58 -
 59
59 -
 60
60 -
 61
61 -
 62
62 -
 63
63 -
 64
64 -
 65
65 -
 66
66 -
 67
67 -
 68
68 -
 69
69 -
70
-
71
-
72
-
73
-
74
-
75
-
76
-
77
-
78
-
79
-
80
-
81
-
82
-
83
-
84
-
85
-
86
-
87
-
88
-
89
-
90
-
91
-
92
-
93
-
94
-
95
-
96
-
97
-
98
-
99
-
100
-
101
-
102
-
103
-
104
-
105
-
106
-
107
-
108
 |
 |

F-7
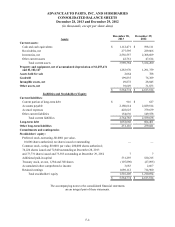
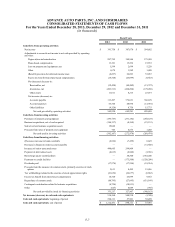
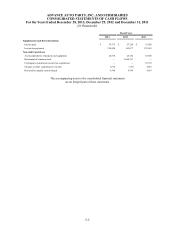
ADVANCE AUTO PARTS, INC. AND SUBSIDIARIES
CONSOLIDATED STATEMENTS OF CASH FLOWS
For the Years Ended December 28, 2013, December 29, 2012 and December 31, 2011
(in thousands)
Fiscal Years
2013 2012 2011
Cash flows from operating activities:
Net income $ 391,758 $ 387,670 $ 394,682
Adjustments to reconcile net income to net cash provided by operating
activities:
Depreciation and amortization 207,795 189,544 175,949
Share-based compensation 13,191 15,236 19,553
Loss on property and equipment, net 1,599 2,699 5,228
Other 1,679 1,582 1,098
(Benefit) provision for deferred income taxes (2,237) 26,893 53,037
Excess tax benefit from share-based compensation (16,320) (23,099) (9,663)
Net (increase) decrease in:
Receivables, net (32,428) (89,482) (15,372)
Inventories, net (203,513) (260,298) (179,288)
Other assets 11,011 8,213 23,073
Net increase (decrease) in:
Accounts payable 113,497 376,631 360,678
Accrued expenses 63,346 40,936 (15,901)
Other liabilities (4,128) 8,756 15,775
Net cash provided by operating activities 545,250 685,281 828,849
Cash flows from investing activities:
Purchases of property and equipment (195,757) (271,182) (268,129)
Business acquisitions, net of cash acquired (186,137) (8,369) (23,133)
Sale of certain business acquisition assets 19,042 — —
Proceeds from sales of property and equipment 745 6,573 1,288
Net cash used in investing activities (362,107) (272,978) (289,974)
Cash flows from financing activities:
(Decrease) increase in bank overdrafts (2,926) (7,459) 6,625
Decrease in financed vendor accounts payable — — (31,648)
Issuance of senior unsecured notes 448,605 299,904 —
Payment of debt related costs (8,815) (2,942) (3,656)
Borrowings under credit facilities — 58,500 1,435,200
Payments on credit facilities — (173,500) (1,320,200)
Dividends paid (17,574) (17,596) (18,554)
Proceeds from the issuance of common stock, primarily exercise of stock
options 3,611 8,495 21,056
Tax withholdings related to the exercise of stock appreciation rights (21,856) (26,677) (6,582)
Excess tax benefit from share-based compensation 16,320 23,099 9,663
Repurchase of common stock (80,795) (27,095) (631,149)
Contingent consideration related to business acquisitions (4,726) (10,911) —
Other (627) 4,089 (938)
Net cash provided by (used in) financing activities 331,217 127,907 (540,183)
Net increase (decrease) in cash and cash equivalents 514,360 540,210 (1,308)
Cash and cash equivalents, beginning of period 598,111 57,901 59,209
Cash and cash equivalents, end of period $ 1,112,471 $ 598,111 $ 57,901