Advance Auto Parts 2013 Annual Report Download - page 87
Download and view the complete annual report
Please find page 87 of the 2013 Advance Auto Parts annual report below. You can navigate through the pages in the report by either clicking on the pages listed below, or by using the keyword search tool below to find specific information within the annual report.-
 1
1 -
2
-
3
-
4
-
5
-
6
-
7
-
8
-
9
-
10
-
11
-
12
-
13
-
14
-
15
-
16
-
17
-
18
-
19
-
20
-
21
-
22
-
23
-
24
-
25
-
26
-
27
-
28
-
29
-
30
-
31
-
32
-
33
-
34
-
35
-
36
-
37
-
38
-
39
-
40
-
41
-
42
-
43
-
44
-
45
-
46
-
47
-
48
-
49
-
50
-
51
-
52
-
53
-
54
-
55
-
56
-
57
-
58
-
59
-
60
-
61
-
62
-
63
-
64
-
65
-
66
-
67
-
68
-
69
-
70
-
71
-
72
-
73
-
74
-
75
-
76
-
 77
77 -
 78
78 -
 79
79 -
 80
80 -
 81
81 -
 82
82 -
 83
83 -
 84
84 -
 85
85 -
 86
86 -
 87
87 -
 88
88 -
 89
89 -
 90
90 -
 91
91 -
 92
92 -
 93
93 -
 94
94 -
 95
95 -
 96
96 -
 97
97 -
98
-
99
-
100
-
101
-
102
-
103
-
104
-
105
-
106
-
107
-
108
 |
 |

ADVANCE AUTO PARTS, INC. AND SUBSIDIARIES
NOTES TO THE CONSOLIDATED FINANCIAL STATEMENTS
December 28, 2013, December 29, 2012 and December 31, 2011
(in thousands, except per share data)
F-35
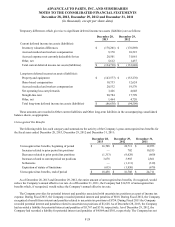
Performance-Based Awards
Performance-based awards granted in the following tables represent the performance portion of awards granted during
Fiscal 2013 at the target level, as achievement of the target level was deemed probable as of the grant date. Change in units
based on performance represents the change in number of awards previously granted that the Company believes will ultimately
vest based on its probability assessment at December 28, 2013.
Compensation expense for performance-based awards of $1,141, $3,267, and $6,714 in Fiscal 2013, 2012 and 2011,
respectively, was determined based on management’s estimate of the probable vesting outcome.
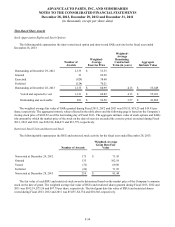
Performance-Based SARs
The following table summarizes the performance-based SARs activity for the fiscal year ended December 28, 2013:
Number of
Awards
Weighted-
Average
Exercise Price
Weighted-
Average
Remaining
Contractual
Term (in years)
Aggregate
Intrinsic Value
Outstanding at December 29, 2012 758 $ 49.93
Granted 231 106.00
Change in units based on performance (137) 59.48
Exercised (296) 32.41
Forfeited (36) 71.67
Outstanding at December 28, 2013 520 $ 78.21 5.46 $ 16,491
Vested and expected to vest 461 $ 75.44 4.86 $ 15,883
Outstanding and exercisable 131 $ 36.13 2.80 $ 9,661
The weighted average fair value of performance-based SARs granted during Fiscal 2013, 2012 and 2011 was $23.72,
$19.23 and $19.86 per share, respectively. The aggregate intrinsic value of performance-based SARs exercised during Fiscal
2013 and 2012 was $14,257 and $34,020, respectively. There were no awards exercised prior to Fiscal 2012. As of
December 28, 2013, the maximum potential payout under the Company’s currently outstanding performance-based SAR
awards was 2,696 units.
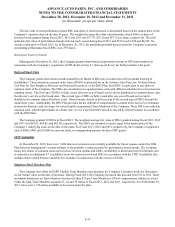
Performance-Based Restricted Stock Units and Restricted Stock
The following table summarizes the performance-based RSUs and restricted stock activity for the fiscal year ended
December 28, 2013:
Number of Awards
Weighted-Average
Grant Date Fair Value
Nonvested at December 29, 2012 102 $ 63.08
Granted 172 77.47
Change in units based on performance (31) 71.23
Vested (31) 42.50
Forfeited (30) 74.70
Nonvested at December 28, 2013 182 $ 75.36