Advance Auto Parts 2013 Annual Report Download - page 68
Download and view the complete annual report
Please find page 68 of the 2013 Advance Auto Parts annual report below. You can navigate through the pages in the report by either clicking on the pages listed below, or by using the keyword search tool below to find specific information within the annual report.-
 1
1 -
2
-
3
-
4
-
5
-
6
-
7
-
8
-
9
-
10
-
11
-
12
-
13
-
14
-
15
-
16
-
17
-
18
-
19
-
20
-
21
-
22
-
23
-
24
-
25
-
26
-
27
-
28
-
29
-
30
-
31
-
32
-
33
-
34
-
35
-
36
-
37
-
38
-
39
-
40
-
41
-
42
-
43
-
44
-
45
-
46
-
47
-
48
-
49
-
50
-
51
-
52
-
53
-
54
-
55
-
56
-
57
-
 58
58 -
 59
59 -
 60
60 -
 61
61 -
 62
62 -
 63
63 -
 64
64 -
 65
65 -
 66
66 -
 67
67 -
 68
68 -
 69
69 -
 70
70 -
 71
71 -
 72
72 -
 73
73 -
 74
74 -
 75
75 -
 76
76 -
 77
77 -
 78
78 -
79
-
80
-
81
-
82
-
83
-
84
-
85
-
86
-
87
-
88
-
89
-
90
-
91
-
92
-
93
-
94
-
95
-
96
-
97
-
98
-
99
-
100
-
101
-
102
-
103
-
104
-
105
-
106
-
107
-
108
 |
 |

ADVANCE AUTO PARTS, INC. AND SUBSIDIARIES
NOTES TO THE CONSOLIDATED FINANCIAL STATEMENTS
December 28, 2013, December 29, 2012 and December 31, 2011
(in thousands, except per share data)
F-16
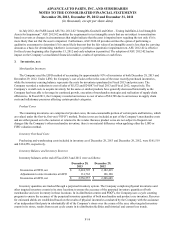
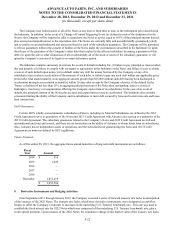
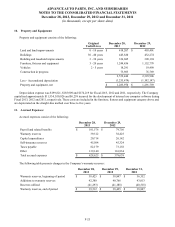
In July 2012, the FASB issued ASU No. 2012-02 “Intangible-Goodwill and Other – Testing Indefinite-Lived Intangible
Assets for Impairment.” ASU 2012-02 modifies the requirement to test intangible assets that are not subject to amortization
based on events or changes in circumstances that might indicate that the asset is impaired now requiring the test only if it is
more likely than not that the asset is impaired. Furthermore, ASU 2012-02 provides entities the option of performing a
qualitative assessment to determine if it is more likely than not that the fair value of an intangible asset is less than the carrying
amount as a basis for determining whether it is necessary to perform a quantitative impairment test. ASU 2012-02 is effective
for fiscal years beginning after September 15, 2012 and early adoption is permitted. The adoption of ASU 2012-02 had no
impact on the Company’s consolidated financial condition, results of operations or cash flows.
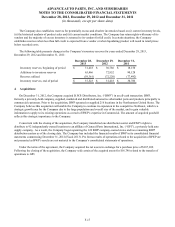
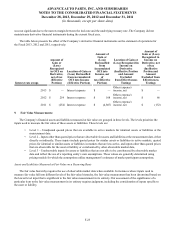
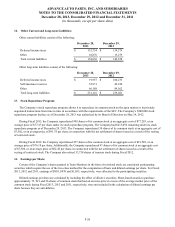
3. Inventories, net:
Merchandise Inventory
The Company used the LIFO method of accounting for approximately 95% of inventories at both December 28, 2013 and
December 29, 2012. Under LIFO, the Company’s cost of sales reflects the costs of the most recently purchased inventories,
while the inventory carrying balance represents the costs for inventories purchased in Fiscal 2013 and prior years. The
Company recorded a reduction to cost of sales of $5,572 and $24,087 in Fiscal 2013 and Fiscal 2012, respectively. The
Company’s overall costs to acquire inventory for the same or similar products have generally decreased historically as the
Company has been able to leverage its continued growth, execution of merchandise strategies and realization of supply chain
efficiencies. In Fiscal 2011, the Company recorded an increase to cost of sales of $24,708 due to an increase in supply chain
costs and inflationary pressures affecting certain product categories.
Product Cores
The remaining inventories are comprised of product cores, the non-consumable portion of certain parts and batteries, which
are valued under the first-in, first-out (“FIFO”) method. Product cores are included as part of the Company’s merchandise costs
and are either passed on to the customer or returned to the vendor. Because product cores are not subject to frequent cost
changes like the Company’s other merchandise inventory, there is no material difference when applying either the LIFO or
FIFO valuation method.
Inventory Overhead Costs
Purchasing and warehousing costs included in inventory as of December 28, 2013 and December 29, 2012, were $161,519
and $134,258, respectively.
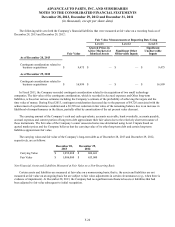
Inventory Balance and Inventory Reserves
Inventory balances at the end of Fiscal 2013 and 2012 were as follows:
December 28,
2013
December 29,
2012
Inventories at FIFO, net $ 2,424,795 $ 2,182,419
Adjustments to state inventories at LIFO 131,762 126,190
Inventories at LIFO, net $ 2,556,557 $ 2,308,609
Inventory quantities are tracked through a perpetual inventory system. The Company completes physical inventories and
other targeted inventory counts in its store locations to ensure the accuracy of the perpetual inventory quantities of both
merchandise and core inventory in these locations. In its distribution centers and PDQ®s, the Company uses a cycle counting
program to ensure the accuracy of the perpetual inventory quantities of both merchandise and product core inventory. Reserves
for estimated shrink are established based on the results of physical inventories conducted by the Company with the assistance
of an independent third party in substantially all of the Company’s stores over the course of the year, other targeted inventory
counts in its stores, results from recent cycle counts in its distribution facilities and historical and current loss trends.