Advance Auto Parts 2013 Annual Report Download - page 77
Download and view the complete annual report
Please find page 77 of the 2013 Advance Auto Parts annual report below. You can navigate through the pages in the report by either clicking on the pages listed below, or by using the keyword search tool below to find specific information within the annual report.-
 1
1 -
2
-
3
-
4
-
5
-
6
-
7
-
8
-
9
-
10
-
11
-
12
-
13
-
14
-
15
-
16
-
17
-
18
-
19
-
20
-
21
-
22
-
23
-
24
-
25
-
26
-
27
-
28
-
29
-
30
-
31
-
32
-
33
-
34
-
35
-
36
-
37
-
38
-
39
-
40
-
41
-
42
-
43
-
44
-
45
-
46
-
47
-
48
-
49
-
50
-
51
-
52
-
53
-
54
-
55
-
56
-
57
-
58
-
59
-
60
-
61
-
62
-
63
-
64
-
65
-
66
-
 67
67 -
 68
68 -
 69
69 -
 70
70 -
 71
71 -
 72
72 -
 73
73 -
 74
74 -
 75
75 -
 76
76 -
 77
77 -
 78
78 -
 79
79 -
 80
80 -
 81
81 -
 82
82 -
 83
83 -
 84
84 -
 85
85 -
 86
86 -
 87
87 -
88
-
89
-
90
-
91
-
92
-
93
-
94
-
95
-
96
-
97
-
98
-
99
-
100
-
101
-
102
-
103
-
104
-
105
-
106
-
107
-
108
 |
 |

ADVANCE AUTO PARTS, INC. AND SUBSIDIARIES
NOTES TO THE CONSOLIDATED FINANCIAL STATEMENTS
December 28, 2013, December 29, 2012 and December 31, 2011
(in thousands, except per share data)
F-25
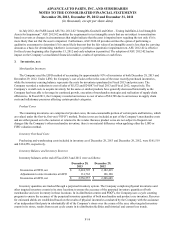
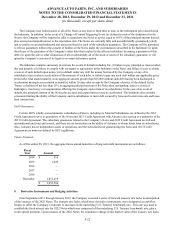
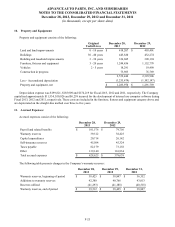
10. Property and Equipment:
Property and equipment consists of the following:
Original
Useful Lives
December 28,
2013
December 29,
2012
Land and land improvements 0 - 10 years $ 418,207 $ 403,401
Buildings 30 - 40 years 445,820 432,274
Building and leasehold improvements 3 - 30 years 336,685 309,194
Furniture, fixtures and equipment 3 - 20 years 1,244,456 1,152,778
Vehicles 2 - 5 years 18,291 19,490
Construction in progress 75,985 76,769
2,539,444 2,393,906
Less - Accumulated depreciation (1,255,474)(1,102,147)
Property and equipment, net $ 1,283,970 $ 1,291,759
Depreciation expense was $199,821, $185,909 and $174,219 for Fiscal 2013, 2012 and 2011, respectively. The Company
capitalized approximately $11,534, $10,026 and $6,258 incurred for the development of internal use computer software during
Fiscal 2013, 2012 and 2011, respectively. These costs are included in the furniture, fixtures and equipment category above and
are depreciated on the straight-line method over three to five years.
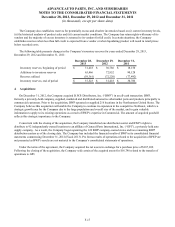
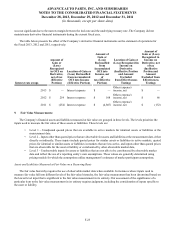
11. Accrued Expenses:
Accrued expenses consist of the following:
December 28,
2013
December 29,
2012
Payroll and related benefits $ 101,576 $ 79,756
Warranty reserves 39,512 38,425
Capital expenditures 20,714 26,142
Self-insurance reserves 45,504 45,324
Taxes payable 82,179 73,158
Other 139,140 116,834
Total accrued expenses $ 428,625 $ 379,639
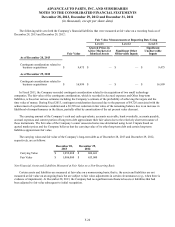
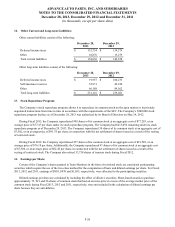
The following table presents changes in the Company’s warranty reserves:
December 28,
2013
December 29,
2012
December 31,
2011
Warranty reserves, beginning of period $ 38,425 $ 38,847 $ 36,352
Additions to warranty reserves 42,380 40,766 43,013
Reserves utilized (41,293)(41,188)(40,518)
Warranty reserves, end of period $ 39,512 $ 38,425 $ 38,847