Advance Auto Parts 2004 Annual Report Download - page 6
Download and view the complete annual report
Please find page 6 of the 2004 Advance Auto Parts annual report below. You can navigate through the pages in the report by either clicking on the pages listed below, or by using the keyword search tool below to find specific information within the annual report.-
 1
1 -
 2
2 -
 3
3 -
 4
4 -
 5
5 -
 6
6 -
 7
7 -
 8
8 -
 9
9 -
 10
10 -
 11
11 -
 12
12 -
 13
13 -
 14
14 -
 15
15 -
 16
16 -
 17
17 -
18
-
19
-
20
-
21
-
22
-
23
-
24
-
25
-
26
-
27
-
28
-
29
-
30
-
31
-
32
-
33
-
34
-
35
-
36
-
37
-
38
-
39
-
40
-
41
-
42
-
43
-
44
-
45
-
46
-
47
-
48
-
49
-
50
-
51
-
52
-
53
-
54
-
55
-
56
-
57
-
58
-
59
 |
 |

“”
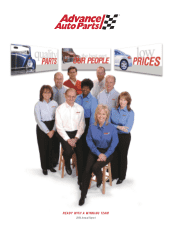
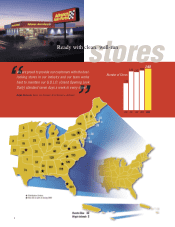
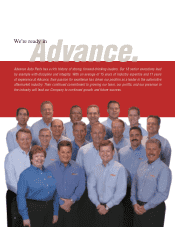
Weareproudtoprovideourcustomerswiththebest-
lookingstoresinourindustryandourteamworks
hardtomaintainourG.O.L.D.(GrandOpeningLook
Daily)standardsevendaysaweekineverystore!
RalphCastanza,SeniorVicePresident,StoreOperations–Northeast
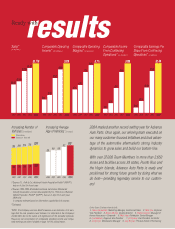
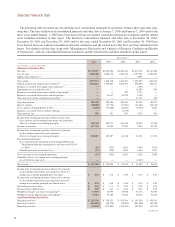
Increasing Number of
Vehicles (in millions)
Increasing Number of
Vehicles* (in millions)
Total Vehicles
Vehicles 6+ Years Old
205
2000
209
2001
214
2002 2003 2004
Comparable Earnings Per
Share From Continuing
Operations (in dollars)
Comparable Earnings Per
Share From Continuing
Operations* (in dollars)
2000
$0.27
2001
$0.61
2002
$1.30
2003
$2.08
$2.49
2004
Comparable Income
From Continuing
Operations* (in millions)
Comparable Income
From Continuing
Operations (in millions)
2000
$15
2001
$36
2002
$94
2003
$155
$188
2004
Comparable Operating
Margins* (in percent)
Comparable Operating
Margin (in percent)
2000
4.1%
2001
4.9%
2002
7.2%
2003
8.4%
8.7%
2004
Comparable Operating
Income* (in millions)
Sales
(in millions)
Comparable Operating
Income (in millions)
2000
$88
2001
$119
2002
$232
2003
$289
$329
2004
Sales*
(in millions)
2000
$2,167
2001
$2,420
2002
$3,204
2003
$3,431
$3,770
2004
0
500
1000
1500
2000
2500
3000
3500
4000
0
50
100
150
200
250
300
350
0
2
4
6
8
10
0
50
100
150
200
0.0
0.5
1.0
1.5
2.0
2.5
0
50
100
150
200
250
300
350
400
Increasing Average
Age of Vehicles**
7.50
7.75
8.00
8.25
8.50
8.75
9.00
9.25
9.50
218
131
128
126
123
224
137
Increasing Average
Age of Vehicles (in years)
8.9
2000
9.0
2001
9.0
2002 2003 2004
9.2
9.3
0
500
1000
1500
2000
2500
3000
Number of Stores
1,729
2000
2,484
2001
2,435
2002 2003 2004
2,539
2,652
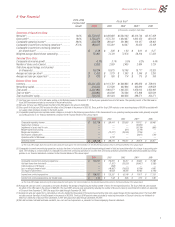
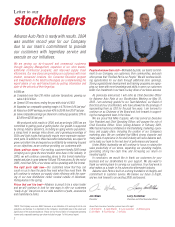
1 2
stores
Readywith clean,well-run
4