Advance Auto Parts 2004 Annual Report Download - page 16
Download and view the complete annual report
Please find page 16 of the 2004 Advance Auto Parts annual report below. You can navigate through the pages in the report by either clicking on the pages listed below, or by using the keyword search tool below to find specific information within the annual report.-
 1
1 -
2
-
3
-
4
-
5
-
 6
6 -
 7
7 -
 8
8 -
 9
9 -
 10
10 -
 11
11 -
 12
12 -
 13
13 -
 14
14 -
 15
15 -
 16
16 -
 17
17 -
 18
18 -
 19
19 -
 20
20 -
 21
21 -
 22
22 -
 23
23 -
 24
24 -
 25
25 -
 26
26 -
27
-
28
-
29
-
30
-
31
-
32
-
33
-
34
-
35
-
36
-
37
-
38
-
39
-
40
-
41
-
42
-
43
-
44
-
45
-
46
-
47
-
48
-
49
-
50
-
51
-
52
-
53
-
54
-
55
-
56
-
57
-
58
-
59
 |
 |

14
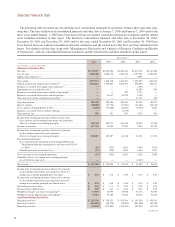
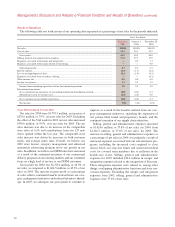
Thefollowingtablesetsforthourselectedhistoricalconsolidatedstatementofoperations,balancesheetandotheroper-
atingdata.TheselectedhistoricalconsolidatedfinancialandotherdataatJanuary1,2005andJanuary3,2004andforthe
threeyearsendedJanuary1,2005havebeenderivedfromourauditedconsolidatedfinancialstatementsandtherelated
notes included elsewhere in this report. The historical consolidated financial and other data at December 28, 2002,
December29,2001andDecember30,2000andfortheyearsendedDecember29,2001andDecember 30,2000have
beenderivedfromourauditedconsolidatedfinancialstatementsandtherelatednotesthathavenotbeenincludedinthis
report.Youshouldreadthisdataalongwith“Management’sDiscussionandAnalysisofFinancialConditionandResults
ofOperations,”andourconsolidatedfinancialstatementsandtherelatednotesincludedelsewhereinthisreport.
FiscalYear(1)(2)
2004 2003 2002 2001 2000
(inthousands,exceptpersharedata)
StatementofOperationsData:
Netsales.................................................................................................... $3,770,297 $3,493,696 $3,204,140 $2,419,746 $2,167,308
Costofsales.............................................................................................. 2,016,926 1,889,178 1,769,733 1,357,594 1,286,295
Supplychaininitiatives(3)......................................................................... —— — 9,099 —
Grossprofit............................................................................................... 1,753,371 1,604,518 1,434,407 1,053,053 881,013
Selling,generalandadministrativeexpenses(4)...................................... 1,424,613 1,305,867 1,202,524 938,300 792,551
Expensesassociatedwithsupplychaininitiatives(5)............................... —— — 1,394 —
Impairmentofassetsheldforsale(6)........................................................ —— — 12,300 856
Expensesassociatedwithmerger-relatedrestructuring(7)....................... —— 597 3,719 —
Expensesassociatedwithmergerandintegration(8)............................... —10,417 34,935 1,135 —
Non-cashstockoptioncompensationexpense(9)..................................... —— — 11,735 729
Operatingincome..................................................................................... 328,758 288,234 196,351 84,470 86,877
Interestexpense........................................................................................ (20,069) (37,576) (77,081) (61,042) (64,212)
(Loss)gainonextinguishmentofdebt.................................................... (3,230) (47,288) (16,822) (6,106) 4,692
Expensesassociatedwithsecondaryoffering......................................... —— (1,733) — —
Otherincome,net..................................................................................... 289 341 963 1,033 581
Incomefromcontinuingoperationsbeforeincometaxes,
(loss)incomeondiscontinuedoperationsandcumulative
effectofachangeinaccountingprinciple.......................................... 305,748 203,711 101,678 18,355 27,938
Incometaxexpense.................................................................................. 117,721 78,424 39,530 7,284 10,787
Incomefromcontinuingoperationsbefore(loss)income
ondiscontinuedoperationsandcumulative
effectofachangeinaccountingprinciple.......................................... 188,027 125,287 62,148 11,071 17,151
Discontinuedoperations:
(Loss)incomefromoperationsofdiscontinuedWholesale
DistributionNetwork(includinglossondisposalof$2,693
in2003)............................................................................................. (63) (572) 4,691 4,040 3,915
(Benefit)provisionforincometaxes................................................... (24) (220) 1,820 1,604 1,507
(Loss)incomeondiscontinuedoperations.............................................. (39) (352) 2,871 2,436 2,408
Cumulativeeffectofachangeinaccountingprinciple,
netof$1,360incometaxes.................................................................. —— — (2,065) —
Netincome................................................................................................ $ 187,988 $ 124,935 $ 65,019 $ 11,442 $ 19,559
Incomefromcontinuingoperationsbefore(loss)income
ondiscontinuedoperationsandcumulativeeffectofa
changeinaccountingprincipleperbasicshare................................... $ 2.54 $ 1.72 $ 0.89 $ 0.19 $ 0.30
Incomefromcontinuingoperationsbefore(loss)income
ondiscontinuedoperationsandcumulativeeffectofa
changeinaccountingprincipleperdilutedshare............................... $ 2.49 $ 1.68 $ 0.86 $ 0.19 $ 0.30
Netincomeperbasicshare...................................................................... $ 2.54 $ 1.71 $ 0.93 $ 0.20 $ 0.35
Netincomeperdilutedshare................................................................... $ 2.49 $ 1.67 $ 0.90 $ 0.20 $ 0.34
Weighted-averagebasicsharesoutstanding(10)........................................ 73,897 72,999 70,098 57,274 56,592
Weighted-averagedilutedsharesoutstanding(10)..................................... 75,481 74,743 72,376 58,316 57,222
CashFlowsProvidedBy(UsedIn):
Operatingactivities.................................................................................. $ 263,794 $ 355,921 $ 242,996 $ 103,536 $ 103,951
Investingactivities.................................................................................... (166,822) (85,474) (78,005) (451,008) (64,940)
Financingactivities.................................................................................. (52,138) (272,845) (169,223) 347,580 (43,579)
(continued)
SelectedFinancialData