Advance Auto Parts 2004 Annual Report Download - page 52
Download and view the complete annual report
Please find page 52 of the 2004 Advance Auto Parts annual report below. You can navigate through the pages in the report by either clicking on the pages listed below, or by using the keyword search tool below to find specific information within the annual report.-
 1
1 -
2
-
3
-
4
-
5
-
6
-
7
-
8
-
9
-
10
-
11
-
12
-
13
-
14
-
15
-
16
-
17
-
18
-
19
-
20
-
21
-
22
-
23
-
24
-
25
-
26
-
27
-
28
-
29
-
30
-
31
-
32
-
33
-
34
-
35
-
36
-
37
-
38
-
39
-
40
-
41
-
 42
42 -
 43
43 -
 44
44 -
 45
45 -
 46
46 -
 47
47 -
 48
48 -
 49
49 -
 50
50 -
 51
51 -
 52
52 -
 53
53 -
 54
54 -
 55
55 -
 56
56 -
 57
57 -
 58
58 -
 59
59
 |
 |
50
NotestoConsolidatedFinancialStatements(continued)
FortheYearsEndedJanuary1,2005,January3,2004,andDecember28,2002(inthousands,exceptpersharedata)
As permitted under SFAS No. 123, “Accounting for
Stock-BasedCompensation,”theCompanyaccountsforits
stockoptionsusingtheintrinsicvaluemethodprescribed
inAccountingPrinciplesBoardOpinionNo.25,“Account-
ingforStockIssuedtoEmployees,”orAPBNo.25.Under
APBNo.25,compensationcostforstockoptionsismea-
sured as the excess, if any, of the market price of the
Company’s common stock at the measurement date over
theexerciseprice.Accordingly,theCompanyhasnotrec-
ognizedcompensationexpenseontheissuanceofitsstock
optionsbecausetheexercisepriceequaledthefairmarket
valueofthe underlyingstockonthe grantdate.Nocom-
pensationexpensewasrequiredforthefiscalyearsended
January1,2005,January3,2004andDecember28,2002.
During fiscal 2002, the Company established an
employee stock purchase plan. The plan is intended to
qualifyasanemployeestockpurchaseplanunderSection
423 of the Internal Revenue Code of 1986, as amended.
In May 2002, the Company registered 700 shares with
the Securities and Exchange Commission to be issued
under the plan. All eligible team members may purchase
common stock at 85% of fair market value (determined
quarterly) through payroll deductions. There are annual
limitations on team member purchases of either $25,000
per team member or 10% of compensation, whichever
is less. Under the plan, team members purchased 118,
147 and 28 shares in fiscal years 2004, 2003 and 2002,
respectively.
20.FairValueofFinancialInstruments
The carrying amount of cash and cash equivalents,
receivables,bankoverdrafts,accountspayable,borrowings
securedbyreceivablesandcurrentportionoflong-termdebt
approximates fair value because of the short maturity of
those instruments. The carrying amount for variable rate
long-term debt approximates fair value for similar issues
availabletotheCompany.Therewasnofixedratelong-term
debtoutstandingatJanuary1,2005orJanuary3,2004.
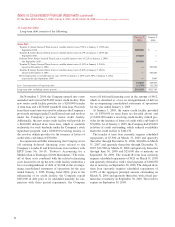
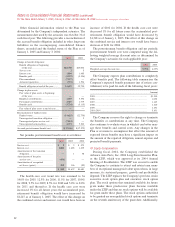
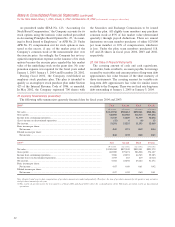
21.QuarterlyFinancialData(unaudited)
Thefollowingtablesummarizesquarterlyfinancialdataforfiscalyears2004and2003:
2004(1) First Second Third Fourth
(16weeks) (12weeks) (12weeks) (12weeks)
Netsales.................................................................................................................................... $1,122,918 $908,412 $890,161 $848,806
Grossprofit............................................................................................................................... 520,898 422,302 416,515 393,656
Incomefromcontinuingoperations......................................................................................... 51,343 53,229 51,399 32,056
(Loss)incomeondiscontinuedoperations.............................................................................. (52) 6 (6) 13
Netincome................................................................................................................................ 51,291 53,235 51,393 32,069
Basicincomepershare:
Netincome............................................................................................................................ 0.69 0.71 0.69 0.44
Dilutedincomepershare:
Netincome............................................................................................................................ 0.68 0.70 0.68 0.43
2003(1) First Second Third Fourth
(16weeks) (12weeks) (12weeks) (13weeks)
Netsales.................................................................................................................................... $1,005,968 $827,348 $839,101 $821,279
Grossprofit............................................................................................................................... 463,989 379,474 386,928 374,127
Incomefromcontinuingoperations......................................................................................... 3,968 43,291 44,745 33,283
Income(loss)ondiscontinuedoperations............................................................................... 1,073 167 419 (2,011)
Netincome................................................................................................................................ 5,041 43,458 45,164 31,272
Basicincomepershare:
Netincome............................................................................................................................ 0.07 0.60 0.61 0.42
Dilutedincomepershare:
Netincome............................................................................................................................ 0.07 0.58 0.60 0.41
Note:Quarterlyandyear-to-datecomputationsofpershareamountsaremadeindependently.Therefore,thesumofpershareamountsforthequartersmaynotagree
withpershareamountsfortheyear.
(1)The results of operations for the four quarters of fiscal 2004 and fiscal 2003 reflect the reclassification of the Wholesale operating results as discontinued
operations.