Advance Auto Parts 2004 Annual Report Download - page 17
Download and view the complete annual report
Please find page 17 of the 2004 Advance Auto Parts annual report below. You can navigate through the pages in the report by either clicking on the pages listed below, or by using the keyword search tool below to find specific information within the annual report.-
 1
1 -
2
-
3
-
4
-
5
-
6
-
 7
7 -
 8
8 -
 9
9 -
 10
10 -
 11
11 -
 12
12 -
 13
13 -
 14
14 -
 15
15 -
 16
16 -
 17
17 -
 18
18 -
 19
19 -
 20
20 -
 21
21 -
 22
22 -
 23
23 -
 24
24 -
 25
25 -
 26
26 -
 27
27 -
28
-
29
-
30
-
31
-
32
-
33
-
34
-
35
-
36
-
37
-
38
-
39
-
40
-
41
-
42
-
43
-
44
-
45
-
46
-
47
-
48
-
49
-
50
-
51
-
52
-
53
-
54
-
55
-
56
-
57
-
58
-
59
 |
 |

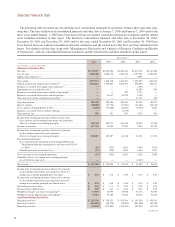
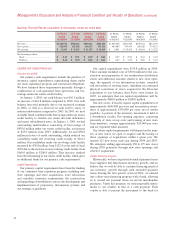
AdvanceAutoParts,Inc.andSubsidiaries
15
FiscalYear(1)(2)
2004 2003 2002 2001 2000
(inthousands,exceptpersharedataandratios)
BalanceSheetandOtherFinancialData:
Cashandcashequivalents............................................................. $ 56,321 $ 11,487 $ 13,885 $ 18,117 $ 18,009
Inventory......................................................................................... $1,201,450 $1,113,781 $1,048,803 $ 982,000 $ 788,914
Inventoryturnover(11)...................................................................... 1.74 1.72 1.75 1.72 1.69
Inventoryperstore(12)..................................................................... $ 453,035 $ 438,669 $ 429,399 $ 392,635 $ 451,281
Accountspayabletoinventoryratio(13).......................................... 53.7% 51.0% 44.9% 43.7% 49.2%
Networkingcapital(14).................................................................... $ 416,302 $ 372,509 $ 462,896 $ 442,099 $ 318,583
Capitalexpenditures(15)................................................................... $ 179,766 $ 101,177 $ 98,186 $ 63,695 $ 70,566
Totalassets..................................................................................... $2,201,962 $1,983,071 $1,965,225 $1,950,615 $1,356,360
Totaldebt........................................................................................ $ 470,000 $ 445,000 $ 735,522 $ 955,737 $ 586,949
Totalnetdebt(16).............................................................................. $ 433,863 $ 464,598 $ 722,506 $ 972,368 $ 582,539
Totalstockholders’equity.............................................................. $ 722,315 $ 631,244 $ 468,356 $ 288,571 $ 156,271
SelectedStoreData:
Comparablestoresalesgrowth(17).................................................. 6.1% 3.1% 5.5% 6.2% 4.4%
Numberofstoresatbeginningofyear.......................................... 2,539 2,435 2,484 1,729 1,617
Newstores.................................................................................. 125 125 110 781 140
Closedstores(18)........................................................................... (12) (21) (159) (26) (28)
Numberofstores,endofperiod.................................................... 2,652 2,539 2,435 2,484 1,729
Relocatedstores.............................................................................. 34 32 39 18 10
Storeswithcommercialdeliveryprogram,endofperiod............ 1,945 1,625 1,411 1,370 1,210
Totalcommercialsales,asapercentageoftotalretailsales........ 18.4% 15.8% 15.0% 16.8% 16.5%
Totalstoresquarefootage,endofperiod...................................... 19,734 18,875 18,108 18,717 13,325
Averagenetsalesperstore(19)......................................................... $ 1,453 $ 1,379 $ 1,303 $ 1,346 $ 1,295
Averagenetsalespersquarefoot(20).............................................. $ 195 $ 186 $ 174 $ 175 $ 168
(1) Ourfiscalyearconsistsof52or53weeksendingontheSaturdaynearesttoDecember31.Allfiscalyearspresentedare52weeks,withtheexceptionof2003,which
consistsof53weeks.
(2) Thestatementofoperationsdataforeachoftheyearspresentedreflectstheoperatingresultsofthewholesalesegmentasdiscontinuedoperations.
(3) Representsrestockingandhandlingfeesassociatedwiththereturnofinventoryasaresultofoursupplychaininitiatives.
(4) Selling,generalandadministrativeexpensesexcludecertainchargesdisclosedseparatelyanddiscussedinnotes(5),(6),(7),(8),and(9)below.
(5) Representscostsofrelocatingcertainequipmentheldatfacilitiesclosedasaresultofoursupplychaininitiatives.
(6) Representsthedevaluationofcertainpropertyheldforsale,includingthe$1.6millionchargetakeninthefirstquarterof2001anda$10.7millionchargetakenin
thefourthquarterof2001.
(7) Representsexpensesrelatedprimarilytoleasecostsassociatedwith27AdvanceAutoPartsstoresidentifiedtobeclosedatDecember29,2001asaresultofthe
Discountacquisition.
(8) Representscertainexpensesrelatedto,amongotherthings,overlappingadministrativefunctionsandstoreconversionsasaresultoftheDiscountacquisition.
(9) Representsnon-cashcompensationexpenserelatedtostockoptionsgrantedtocertainofourteammembers,includingachargeof$8.6millioninthefourthquarter
of2001relatedtovariableprovisionsofourstockoptionplansthatwereinplacewhenwewereaprivatecompanyandeliminatedin2001.
(10) Shares outstanding for each of the years presented gives effect to a 2 for 1 stock split effectuated by us in the form of a 100% stock dividend distributed on
January2,2004.
(11) Inventoryturnoveriscalculatedascostofsalesdividedbytheaverageofbeginningandendinginventories.Thefiscal2003costofsalesexcludestheeffectofthe
53rdweekintheamountof$34.3million.Thefiscal2001amountswerecalculatedbyreducingtheDiscountinventorybalancesbyone-thirteenthtoreflectour
ownershipofthatinventoryfromDecember2,2001(theacquisitiondate)throughDecember29,2001.
(12) Inventoryperstorecalculatedasendinginventorydividedbyendingstorecount.Endinginventoryusedinthiscalculationexcludescertaininventoryrelatedtothe
wholesalesegmentwiththeexceptionoffiscal2003andfiscal2004.
(13) Accountspayabletoinventoryratioiscalculatedasendingaccountspayabledividedbyendinginventory.Beginninginfiscal2004,asaresultofournewvendor
financingprogram,weaggregatefinancedvendoraccountspayablewithendingaccountspayabletocalculateouraccountspayabletoinventoryratio.
(14) Networkingcapitaliscalculatedbysubtractingcurrentliabilitiesfromcurrentassets.
(15) Capitalexpendituresfor2001exclude $34.1millionforourNovember 2001purchaseofDiscount’sGallman,Mississippidistributionfacilityfrom thelessorin
connectionwiththeDiscountacquisition.
(16) Netdebtincludestotaldebtandbankoverdrafts,lesscashandcashequivalents.
(17) Comparable store sales is calculated based on the change in net sales starting once a store has been open for 13 complete accounting periods (each period
represents four weeks). Relocations are included in comparable store sales from the original date of opening. Stores acquired in the Discount acquisition are
includedinthecomparablesalescalculationbeginninginDecember2002,whichwas13completeaccountingperiodsaftertheacquisitiondateofNovember28,
2001.Wedonotincludenetsalesfromthe35WesternAutoretailstoresinourcomparablestorecalculationasaresultoftheiruniqueproductofferings,including
automotiveserviceandtires.In2003,thecomparablestoresalescalculationincludedsalesfromour53rdweekcomparedtoourfirstweekofoperationin2003(the
comparablecalendarweek).In2004,asaresultofthe53rdweekin2003,thecomparablestoresalescalculationexcludesweekoneofsalesfrom2003.
(18) Closedstoresin2002include133DiscountandAdvancestoresclosedaspartoftheintegrationofDiscount.
(19) Averagenetsalesperstoreiscalculated asnetsalesdividedbytheaverageofbeginning andendingnumber ofstores fortherespectiveperiod.Thefiscal2003
netsalesexcludetheeffectofthe53rdweekintheamountof$63.0million.Thefiscal2001amountswerecalculatedbyreducingthenumberofDiscountstoresby
one-thirteenthtoreflectourownershipofDiscountfromDecember2,2001(theacquisitiondate)throughDecember29,2001.
(20) Averagenetsalespersquarefootiscalculatedasnetsalesdividedbytheaverageofthebeginningandendingtotalstoresquarefootagefortherespectiveperiod.
Thefiscal2003netsalesexcludetheeffectofthe53rdweekintheamountof$63.0million.Thefiscal2001amountswerecalculatedbyreducingthenumberof
Discountstoresbyone-thirteenthtoreflectourownershipofDiscountfromDecember2,2001(theacquisitiondate)throughDecember29,2001.