Advance Auto Parts 2004 Annual Report Download - page 32
Download and view the complete annual report
Please find page 32 of the 2004 Advance Auto Parts annual report below. You can navigate through the pages in the report by either clicking on the pages listed below, or by using the keyword search tool below to find specific information within the annual report.-
 1
1 -
2
-
3
-
4
-
5
-
6
-
7
-
8
-
9
-
10
-
11
-
12
-
13
-
14
-
15
-
16
-
17
-
18
-
19
-
20
-
21
-
 22
22 -
 23
23 -
 24
24 -
 25
25 -
 26
26 -
 27
27 -
 28
28 -
 29
29 -
 30
30 -
 31
31 -
 32
32 -
 33
33 -
 34
34 -
 35
35 -
 36
36 -
 37
37 -
 38
38 -
 39
39 -
 40
40 -
 41
41 -
 42
42 -
43
-
44
-
45
-
46
-
47
-
48
-
49
-
50
-
51
-
52
-
53
-
54
-
55
-
56
-
57
-
58
-
59
 |
 |

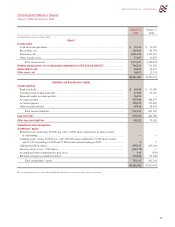
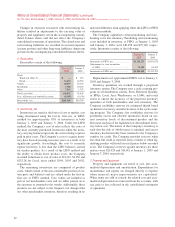
30
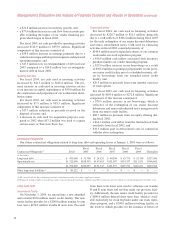
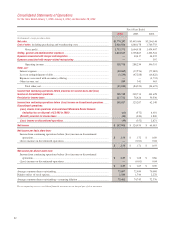
FiscalYearsEnded
2004 2003 2002
(inthousands,exceptpersharedata)
Netsales............................................................................................................................... $3,770,297 $3,493,696 $3,204,140
Costofsales,includingpurchasingandwarehousingcosts............................................... 2,016,926 1,889,178 1,769,733
Grossprofit.............................................................................................................. 1,753,371 1,604,518 1,434,407
Selling,generalandadministrativeexpenses..................................................................... 1,424,613 1,305,867 1,202,524
Expensesassociatedwithmergerandintegration............................................................... —10,417 34,935
Expensesassociatedwithmerger-relatedrestructuring...................................................... —— 597
Operatingincome.................................................................................................... 328,758 288,234 196,351
Other,net:
Interestexpense............................................................................................................... (20,069) (37,576) (77,081)
Lossonextinguishmentofdebt...................................................................................... (3,230) (47,288) (16,822)
Expensesassociatedwithsecondaryoffering................................................................ —— (1,733)
Otherincome,net............................................................................................................ 289 341 963
Totalother,net......................................................................................................... (23,010) (84,523) (94,673)
Incomefromcontinuingoperationsbeforeprovisionforincometaxesand(loss)
incomeondiscontinuedoperations...................................................................................... 305,748 203,711 101,678
Provisionforincometaxes................................................................................................... 117,721 78,424 39,530
Incomefromcontinuingoperationsbefore(loss)incomeondiscontinuedoperations........ 188,027 125,287 62,148
Discontinuedoperations:
(Loss)incomefromoperationsofdiscontinuedWholesaleDealerNetwork
(includinglossondisposalof$2,693in2003)............................................................ (63) (572) 4,691
(Benefit)provisionforincometaxes................................................................................ (24) (220) 1,820
(Loss)incomeondiscontinuedoperations....................................................................... (39) (352) 2,871
Netincome........................................................................................................................... $ 187,988 $ 124,935 $ 65,019
Netincomeperbasicsharefrom:
Incomefromcontinuingoperationsbefore(loss)incomeondiscontinued
operations..................................................................................................................... $ 2.54 $ 1.72 $ 0.89
(Loss)incomeondiscontinuedoperations..................................................................... —(0.01) 0.04
$ 2.54 $ 1.71 $ 0.93
Netincomeperdilutedsharefrom:
Incomefromcontinuingoperationsbefore(loss)incomeondiscontinued
operations..................................................................................................................... $ 2.49 $ 1.68 $ 0.86
(Loss)incomeondiscontinuedoperations..................................................................... —(0.01) 0.04
$ 2.49 $ 1.67 $ 0.90
Averagecommonsharesoutstanding.................................................................................. 73,897 72,999 70,098
Dilutiveeffectofstockoptions........................................................................................... 1,584 1,744 2,278
Averagecommonsharesoutstanding—assumingdilution................................................ 75,481 74,743 72,376
Theaccompanyingnotestoconsolidatedfinancialstatementsareanintegralpartofthesestatements.
ConsolidatedStatementsofOperations
FortheYearsEndedJanuary1,2005,January3,2004,andDecember28,2002