Advance Auto Parts 2004 Annual Report Download - page 3
Download and view the complete annual report
Please find page 3 of the 2004 Advance Auto Parts annual report below. You can navigate through the pages in the report by either clicking on the pages listed below, or by using the keyword search tool below to find specific information within the annual report.-
 1
1 -
 2
2 -
 3
3 -
 4
4 -
 5
5 -
 6
6 -
 7
7 -
 8
8 -
 9
9 -
 10
10 -
 11
11 -
 12
12 -
 13
13 -
 14
14 -
15
-
16
-
17
-
18
-
19
-
20
-
21
-
22
-
23
-
24
-
25
-
26
-
27
-
28
-
29
-
30
-
31
-
32
-
33
-
34
-
35
-
36
-
37
-
38
-
39
-
40
-
41
-
42
-
43
-
44
-
45
-
46
-
47
-
48
-
49
-
50
-
51
-
52
-
53
-
54
-
55
-
56
-
57
-
58
-
59
 |
 |
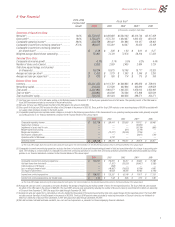
5-YearFinancial
2000–2004
Compounded
Growth
FiscalYear(1)
2004 2003 2002 2001(a) 2000
(inthousands,exceptpersharedata)
StatementofOperationsData:
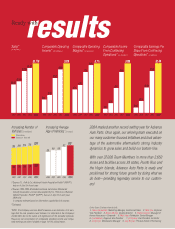
Netsales(2)............................................................................ 14.8% $3,770,297 $3,430,680 $3,204,140 $2,419,746 $2,167,308
Grossprofit(3)........................................................................ 18.8% 1,753,371 1,575,756 1,434,407 1,062,152 881,013
Comparableoperatingincome(4).......................................... 38.8% 328,758 289,441 231,883 119,127 88,462
Comparableincomefromcontinuingoperations(5).............. 87.6% 188,027 155,091 94,267 35,652 15,188
Comparableincomefromcontinuingoperations
perdilutedshare(5)........................................................... $ 2.49 $ 2.08 $ 1.30 $ 0.61 $ 0.27
Weightedaveragedilutedsharesoutstanding..................... 75,481 74,743 72,376 58,316 57,222
SelectedStoreData:
Comparablestoresalesgrowth............................................ 6.1% 3.1% 5.5% 6.2% 4.4%
Numberofstores,endofperiod.......................................... 2,652 2,539 2,435 2,484 1,729
Totalstoresquarefootage,endofperiod
(inthousands).................................................................. 19,734 18,875 18,108 18,717 13,325
Averagenetsalesperstore(6)............................................... $ 1,453 $ 1,379 $ 1,303 $ 1,346 $ 1,295
Averagenetsalespersquarefoot(7)..................................... $ 195 $ 186 $ 174 $ 175 $ 168
BalanceSheetData:
Inventory............................................................................... $1,201,450 $1,113,781 $1,048,803 $ 982,000 $ 788,914
Networkingcapital............................................................... 416,302 372,509 462,896 442,099 318,583
Totalassets........................................................................... 2,201,962 1,983,071 1,965,225 1,950,615 1,356,360
Totalnetdebt(8)..................................................................... 433,863 464,598 722,506 972,368 582,539
Totalstockholders’equity..................................................... 722,315 631,244 468,356 288,571 156,271
(1)Ourfiscalyearconsistsof52or53weeksendingontheSaturdaynearesttoDecember31.Allfiscalyearspresentedconsistof52weeks.Theoperatingresultsofthe53rdweekin
fiscal2003havebeenexcludedasreconciledinthebelowfootnotes.
(2)Netsalesforfiscalyear2003excludetheeffectofthe53rdweekintheamountof$63,016.
(3)Grossprofitforfiscalyear2003excludestheeffectofthe53rdweekintheamountof$28,762.Grossprofitforfiscal2001excludesanon-recurringchargeof$9,099associatedwith
oursupplychaininitiativesrecordedinthefourthquarter.
(4)Comparableoperatingincomeexcludescertainchargesasincludedinthefollowingreconciliationofthismeasurementtoouroperatingincomepresentedundergenerallyaccepted
accountingpoliciesinourfinancialstatementscontainedintheFinancialReviewofthisannualreport.
2004 2003 2002 2001(a) 2000
Comparableoperatingincome.................................................................................... $ 328,758 $ 289,441 $ 231,883 $ 119,127 $ 88,462
Supplychaininitiatives............................................................................................... —— — (10,492) —
Impairmentofassetsheldforsale.............................................................................. —— — (10,700) (856)
Merger-relatedrestructuring........................................................................................ —— (597) (3,719) —
Mergerandintegration................................................................................................ —(10,417)(34,935) (1,135) —
Stockoptioncompensation......................................................................................... —— — (8,611) (729)
Operationseffectof53rdweek.................................................................................... — 9,210 — — —
Operatingincome........................................................................................................ $ 328,758 $ 288,234 $ 196,351 $ 84,470 $ 86,877
(a)Thefiscal2001chargesrepresentonlythosetakenduringthefourthquarter.FormoreinformationseetheSelectedFinancialDatasectionintheFinancialReviewofthisannualreport.
(5)Comparableincomefromcontinuingoperationsexcludestheitemsinfootnote(4)aboveandtheearlyextinguishmentofdebtandcumulativeeffectofachangeinaccountingprin-
ciple.Thefollowingisareconciliationofcomparableincomefromcontinuingoperationstoincomefromcontinuingoperationspresentedundergenerallyacceptedaccounting
policiesinourfinancialstatementscontainedintheFinancialReviewofthisannualreport.
2004 2003 2002 2001(a) 2000
Comparableincomefromcontinuingoperations........................................................ $ 188,027 $ 155,091 $ 94,267 $ 35,652 $ 15,188
Addbackitemsfromfootnote(4)................................................................................. —(1,207)(35,532) (34,657) (1,585)
Interestexpensein53rdweek..................................................................................... —(368)———
Lossonextinguishmentofdebt.................................................................................. —(46,887)(16,822) (6,106) 4,692
Taximpactofaboveitems........................................................................................... — 18,658 20,235 16,182 (1,144)
Incomefromcontinuingoperations............................................................................ $ 188,027 $ 125,287 $ 62,148 $ 11,071 $ 17,151
Incomefromcontinuingoperationsperdilutedshare................................................ $ 2.49 $ 1.68 $ 0.86 $ 0.19 $ 0.30
(a)Thefiscal2001chargesrepresentonlythosetakenduringthefourthquarter.FormoreinformationseetheSelectedFinancialDatasectionintheFinancialReviewofthisannualreport.
(6)Averagenetsalesperstoreiscalculatedasnetsalesdividedbytheaverageofbeginningandendingnumberofstoresfortherespectiveperiod.Thefiscal2003netsalesexclude
theeffectofthe53rdweekintheamountof$63,016.Thefiscal2001amountswerecalculatedbyreducingthenumberofDiscountstoresbyone-thirteenthtoreflectourownership
ofDiscountfromDecember2,2001(theacquisitiondate)throughDecember29,2001.
(7)Averagenetsalespersquarefootiscalculatedasnetsalesdividedbytheaverageofthebeginningandendingtotalstoresquarefootagefortherespectiveperiod.Thefiscal2003
netsalesexcludetheeffectofthe53rdweekintheamountof$63,016.Thefiscal2001amountswerecalculatedbyreducingthenumberofDiscountstoresbyone-thirteenthto
reflectourownershipofDiscountfromDecember2,2001(theacquisitiondate)throughDecember29,2001.
(8)Netdebtincludestotaldebtandbankoverdrafts,lesscashandcashequivalentsaspresentedontheaccompanyingfinancialstatements.
1
AdvanceAutoParts,Inc.andSubsidiaries