Advance Auto Parts 2004 Annual Report Download - page 22
Download and view the complete annual report
Please find page 22 of the 2004 Advance Auto Parts annual report below. You can navigate through the pages in the report by either clicking on the pages listed below, or by using the keyword search tool below to find specific information within the annual report.-
 1
1 -
2
-
3
-
4
-
5
-
6
-
7
-
8
-
9
-
10
-
11
-
 12
12 -
 13
13 -
 14
14 -
 15
15 -
 16
16 -
 17
17 -
 18
18 -
 19
19 -
 20
20 -
 21
21 -
 22
22 -
 23
23 -
 24
24 -
 25
25 -
 26
26 -
 27
27 -
 28
28 -
 29
29 -
 30
30 -
 31
31 -
 32
32 -
33
-
34
-
35
-
36
-
37
-
38
-
39
-
40
-
41
-
42
-
43
-
44
-
45
-
46
-
47
-
48
-
49
-
50
-
51
-
52
-
53
-
54
-
55
-
56
-
57
-
58
-
59
 |
 |

20
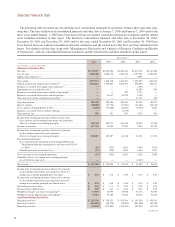
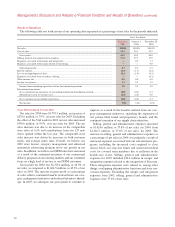
ResultsofOperations
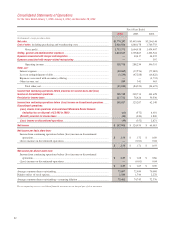
Thefollowingtablesetsforthcertainofouroperatingdataexpressedasapercentageofnetsalesfortheperiodsindicated.
FiscalYearEnded
January1,
2005
January3,
2004
December28,
2002
Netsales....................................................................................................................................................... 100.0% 100.0% 100.0%
Costofsales................................................................................................................................................. 53.5 54.1 55.2
Grossprofit.............................................................................................................................................. 46.5 45.9 44.8
Selling,generalandadministrativeexpenses............................................................................................ 37.8 37.3 37.6
Expensesassociatedwithmergerandintegration..................................................................................... —0.3 1.1
Expensesassociatedwithmergerrelatedrestructuring............................................................................. —— 0.0
Operatingincome.................................................................................................................................... 8.7 8.3 6.1
Interestexpense........................................................................................................................................... (0.5) (1.1) (2.4)
Lossonextinguishmentofdebt.................................................................................................................. (0.1) (1.4) (0.5)
Expensesassociatedwithsecondaryoffering............................................................................................ —— (0.1)
Otherincome,net........................................................................................................................................ 0.0 0.0 0.0
Incometaxexpense..................................................................................................................................... 3.1 2.2 1.2
Incomefromcontinuingoperationsbeforediscontinuedoperations.................................................... 5.0 3.6 1.9
Discontinuedoperations:
(Loss)incomefromoperationsofdiscontinuedwholesaledistributionnetwork................................. (0.0) (0.0) 0.1
(Benefit)provisionforincometaxes...................................................................................................... (0.0) (0.0) 0.0
(Loss)incomeondiscontinuedoperations............................................................................................. (0.0) (0.0) 0.1
Netincome............................................................................................................................................... 5.0% 3.6% 2.0%
Management’sDiscussionandAnalysisofFinancialConditionandResultsofOperations(continued)
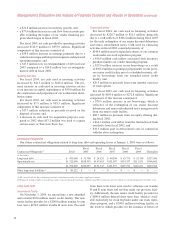
Fiscal2004ComparedtoFiscal2003
Netsalesfor2004were$3,770.3million,anincreaseof
$276.6million,or7.9%,overnetsalesfor2003.Excluding
theeffectofthe53rdweekfor2003ournetsalesincreased
$339.6million,or 9.9%,overnetsales for2003.Thenet
sales increase was due to an increase in the comparable
store sales of 6.1% and contributions from our 125 new
stores opened within the last year. The comparable store
sales increase was driven by increases in both customer
traffic and average ticket sales. Overall, we believe our
2010 store format, category management and enhanced
nationwide advertising program drove our growth in net
sales.Inaddition,webelieveourDIFMsaleshaveincreased
as a result of the continued execution of our commercial
deliveryprogramsinourexistingmarketsandourcontinued
focusonahighlevelofservicetoourDIFMcustomers.
Grossprofitfor2004was$1,753.4million,or46.5%of
netsales,ascomparedto$1,604.5million,or45.9%ofnet
sales,in2003.Theincreaseingrossprofitasapercentage
ofsalesreflectscontinuedbenefitsrealizedfromourcate-
gorymanagementinitiativesandreducedinventoryshrink-
age.In2005,weanticipateourgrossprofittocontinueto
improveasaresultofthebenefitsrealizedfromourcate-
gory management initiatives, including the expansion of
our private label brand and proprietary brands, and the
continuedexecutionofoursupplychaininitiatives.
Selling, general and administrative expenses increased
to$1,424.6million,or37.8%ofnetsales,for2004,from
$1,316.3 million, or 37.6% of net sales, for 2003. The
increaseinselling,generalandadministrativeexpensesas
apercentageofnetsalesin2004wasprimarilyaresultof
increasedexpensesassociatedwithourself-insurancepro-
grams, including the increased costs required to close
claims below our stop-loss limits and increased medical
costs for covered team members due to inflation in the
health care sector. Selling, general and administrative
expenses for 2003 included $10.4 million in merger and
integrationexpensesrelatedtotheintegrationofDiscount.
These integration expenses were related to, among other
things,overlappingadministrativefunctionsandstorecon-
version expenses. Excluding the merger and integration
expenses from 2003, selling, general and administrative
expenseswere37.3%ofnetsales.