Abercrombie & Fitch 2014 Annual Report Download - page 71
Download and view the complete annual report
Please find page 71 of the 2014 Abercrombie & Fitch annual report below. You can navigate through the pages in the report by either clicking on the pages listed below, or by using the keyword search tool below to find specific information within the annual report.-
 1
1 -
2
-
3
-
4
-
5
-
6
-
7
-
8
-
9
-
10
-
11
-
12
-
13
-
14
-
15
-
16
-
17
-
18
-
19
-
20
-
21
-
22
-
23
-
24
-
25
-
26
-
27
-
28
-
29
-
30
-
31
-
32
-
33
-
34
-
35
-
36
-
37
-
38
-
39
-
40
-
41
-
42
-
43
-
44
-
45
-
46
-
47
-
48
-
49
-
50
-
51
-
52
-
53
-
54
-
55
-
56
-
57
-
58
-
59
-
60
-
 61
61 -
 62
62 -
 63
63 -
 64
64 -
 65
65 -
 66
66 -
 67
67 -
 68
68 -
 69
69 -
 70
70 -
 71
71 -
 72
72 -
 73
73 -
 74
74 -
 75
75 -
 76
76 -
 77
77 -
 78
78 -
 79
79 -
 80
80 -
 81
81 -
82
-
83
-
84
-
85
-
86
-
87
-
88
-
89
 |
 |

ABERCROMBIE & FITCH CO.
NOTES TO CONSOLIDATED FINANCIAL STATEMENTS — (Continued)
71
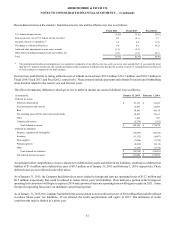
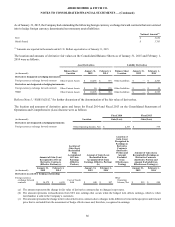
A reconciliation of the Company's segment operating income to the consolidated operating income reported in the Company's
Consolidated Statements of Operations and Comprehensive (Loss) Income follows:
(in thousands) Fiscal 2014 Fiscal 2013 Fiscal 2012
Segment Operating Income $ 735,272 $ 738,864 $ 1,052,390
Operating (Loss) Income Not Attributable to Segments:
Stores and Distribution Expense (164,765) (198,910) (223,611)
Marketing, General and Administrative Expense (460,917) (481,783) (473,880)
Restructuring Charges — (421) —
Asset Impairment (11,310) — —
Other Operating Income, Net 15,239 23,073 19,334
Operating Income $ 113,519 $ 80,823 $ 374,233
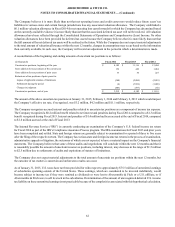
Net Sales:
Net sales includes net merchandise sales through stores and direct-to-consumer operations, including shipping and handling
revenue. Net sales are reported by geographic area based on the location of the customer.
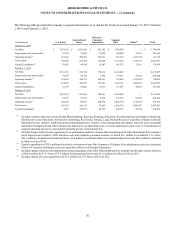
Brand Information
Net sales by brand were as follows:
(in thousands) Fiscal 2014 Fiscal 2013 Fiscal 2012
Abercrombie & Fitch $ 1,449,946 $ 1,547,216 $ 1,704,190
abercrombie 321,353 346,739 382,509
Hollister 1,947,869 2,127,816 2,314,462
Gilly Hicks 24,862 95,126 109,644
Total $ 3,744,030 $ 4,116,897 $ 4,510,805
Geographic Information
Net sales by geographic area were as follows:
(in thousands) Fiscal 2014 Fiscal 2013 Fiscal 2012
United States $ 2,408,427 $ 2,659,089 $ 3,087,205
Europe 959,981 1,116,781 1,137,664
Other International 375,622 341,027 285,936
Total $ 3,744,030 $ 4,116,897 $ 4,510,805
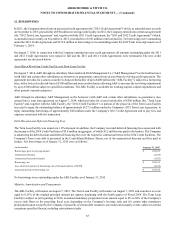
Net long-lived assets by geographic area, which include primarily property and equipment (net), store supplies and lease deposits,
were as follows:
(in thousands) January 31, 2015 February 1, 2014
United States $ 581,430 $ 606,758
Europe 326,726 438,931
Other International 158,743 191,312
Total $ 1,066,899 $ 1,237,001