Abercrombie & Fitch 2014 Annual Report Download - page 25
Download and view the complete annual report
Please find page 25 of the 2014 Abercrombie & Fitch annual report below. You can navigate through the pages in the report by either clicking on the pages listed below, or by using the keyword search tool below to find specific information within the annual report.-
 1
1 -
2
-
3
-
4
-
5
-
6
-
7
-
8
-
9
-
10
-
11
-
12
-
13
-
14
-
 15
15 -
 16
16 -
 17
17 -
 18
18 -
 19
19 -
 20
20 -
 21
21 -
 22
22 -
 23
23 -
 24
24 -
 25
25 -
 26
26 -
 27
27 -
 28
28 -
 29
29 -
 30
30 -
 31
31 -
 32
32 -
 33
33 -
 34
34 -
 35
35 -
36
-
37
-
38
-
39
-
40
-
41
-
42
-
43
-
44
-
45
-
46
-
47
-
48
-
49
-
50
-
51
-
52
-
53
-
54
-
55
-
56
-
57
-
58
-
59
-
60
-
61
-
62
-
63
-
64
-
65
-
66
-
67
-
68
-
69
-
70
-
71
-
72
-
73
-
74
-
75
-
76
-
77
-
78
-
79
-
80
-
81
-
82
-
83
-
84
-
85
-
86
-
87
-
88
-
89
 |
 |

25
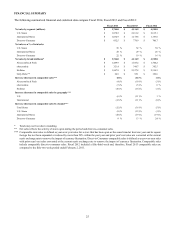
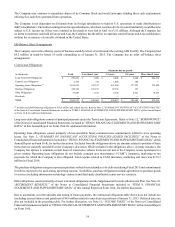
FINANCIAL SUMMARY
The following summarized financial and statistical data compare Fiscal 2014, Fiscal 2013 and Fiscal 2012:
Fiscal 2014 Fiscal 2013 Fiscal 2012
Net sales by segment (millions) $ 3,744.0 $ 4,116.9 $ 4,510.8
U.S. Stores $ 1,878.5 $ 2,161.2 $ 2,615.1
International Stores $ 1,032.9 $ 1,178.8 $ 1,195.0
Direct-to-Consumer $ 832.5 $ 776.9 $ 700.7
Net sales as a % of total sales
U.S. Stores 50 % 52 % 58 %
International Stores 28 % 29 % 26 %
Direct-to-Consumer 22 % 19 % 16 %
Net sales by brand (millions)* $ 3,744.0 $ 4,116.9 $ 4,510.8
Abercrombie & Fitch $ 1,449.9 $ 1,547.2 $ 1,704.2
abercrombie $ 321.4 $ 346.7 $ 382.5
Hollister $ 1,947.9 $ 2,127.8 $ 2,314.5
Gilly Hicks** $ 24.9 $ 95.1 $ 109.6
Increase (decrease) in comparable sales*** (8)% (11)% (1)%
Abercrombie & Fitch (4 )% (10 )% (3 )%
abercrombie (7 )% (5 )% 0 %
Hollister (10 )% (14 )% (1 )%
Increase (decrease) in comparable sales by geography***
U.S. (6 )% (11 )% 1 %
International (12 )% (11 )% (8 )%
Increase (decrease) in comparable sales by channel***
Total Stores (12 )% (16 )% (5 )%
U.S. Stores (9 )% (15 )% (1 )%
International Stores (18 )% (19 )% (19 )%
Direct-to-Consumer 8 % 13 % 24 %
* Totals may not foot due to rounding.
** Net sales reflects the activity of stores open during the period and direct-to-consumer sales.
*** Comparable store sales is defined as year-over-year sales for a store that has been open as the same brand at least one year and its square
footage has not been expanded or reduced by more than 20% within the past year and prior year's net sales are converted at the current
year's exchange rate to remove the impact of currency fluctuation. Direct-to-Consumer comparable sales is defined as year-over-year sales
with prior year's net sales converted at the current year's exchange rate to remove the impact of currency fluctuation. Comparable sales
include comparable direct-to-consumer sales. Fiscal 2012 included a fifty-third week and, therefore, Fiscal 2013 comparable sales are
compared to the fifty-two week period ended February 2, 2013.