Abercrombie & Fitch 2014 Annual Report Download - page 22
Download and view the complete annual report
Please find page 22 of the 2014 Abercrombie & Fitch annual report below. You can navigate through the pages in the report by either clicking on the pages listed below, or by using the keyword search tool below to find specific information within the annual report.-
 1
1 -
2
-
3
-
4
-
5
-
6
-
7
-
8
-
9
-
10
-
11
-
 12
12 -
 13
13 -
 14
14 -
 15
15 -
 16
16 -
 17
17 -
 18
18 -
 19
19 -
 20
20 -
 21
21 -
 22
22 -
 23
23 -
 24
24 -
 25
25 -
 26
26 -
 27
27 -
 28
28 -
 29
29 -
 30
30 -
 31
31 -
 32
32 -
33
-
34
-
35
-
36
-
37
-
38
-
39
-
40
-
41
-
42
-
43
-
44
-
45
-
46
-
47
-
48
-
49
-
50
-
51
-
52
-
53
-
54
-
55
-
56
-
57
-
58
-
59
-
60
-
61
-
62
-
63
-
64
-
65
-
66
-
67
-
68
-
69
-
70
-
71
-
72
-
73
-
74
-
75
-
76
-
77
-
78
-
79
-
80
-
81
-
82
-
83
-
84
-
85
-
86
-
87
-
88
-
89
 |
 |

22
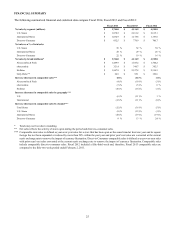
ITEM 6. SELECTED FINANCIAL DATA.
The following financial information is derived from our Consolidated Financial Statements. The information presented below
should be read in conjunction with "MANAGEMENT'S DISCUSSION AND ANALYSIS OF FINANCIAL CONDITION
AND RESULTS OF OPERATION" in Item 7 and the Company's Consolidated Financial Statements and notes thereto included
in Item 8. We have also included certain non-financial information to enhance the understanding of our business.
(Thousands, except per share and per square foot amounts, ratios and store and associate data)
Fiscal 2014 Fiscal 2013 Fiscal 2012(1) Fiscal 2011 Fiscal 2010
Statement of Operations Data
Net Sales $ 3,744,030 $ 4,116,897 $ 4,510,805 $ 4,158,058 $ 3,468,777
Gross Profit $ 2,313,570 $ 2,575,435 $ 2,816,709 $ 2,550,224 $ 2,217,429
Operating Income $ 113,519 $ 80,823 $ 374,233 $ 221,384 $ 237,180
Net Income $ 51,821 $ 54,628 $ 237,011 $ 143,934 $ 155,709
Net Income per Basic Share $ 0.72 $ 0.71 $ 2.89 $ 1.66 $ 1.77
Net Income per Diluted Share $ 0.71 $ 0.69 $ 2.85 $ 1.61 $ 1.73
Basic Weighted-Average Shares Outstanding 71,785 77,157 81,940 86,848 88,061
Diluted Weighted-Average Shares Outstanding 72,937 78,666 83,175 89,537 89,851
Cash Dividends Declared Per Share $ 0.80 $ 0.80 $ 0.70 $ 0.70 $ 0.70
Balance Sheet Data
Working Capital(2) $ 679,016 $ 752,344 $ 617,023 $ 858,248 $ 927,024
Current Ratio(3) 2.40 2.32 1.89 2.23 2.68
Total Assets $ 2,505,167 $ 2,850,997 $ 2,987,401 $ 3,117,032 $ 2,994,022
Borrowings, Net $ 293,412 135,000 $ — $ — $ 43,805
Leasehold Financing Obligations $ 50,521 $ 60,726 $ 63,942 $ 57,851 $ 24,761
Total Stockholders’ Equity $ 1,389,701 $ 1,729,493 $ 1,818,268 $ 1,931,335 $ 1,943,391
Return on Average Stockholders’ Equity(4) 3 % 3 % 13 % 7% 8%
Other Financial and Operating Data
Net Cash Provided by Operating Activities $ 312,480 $ 175,493 $ 684,171 $ 365,219 $ 391,789
Net Cash Used for Investing Activities $ (175,074) $ (173,861) $ (247,238) $ (340,689) $ (92,976)
Net Cash Used for Financing Activities $ (181,453) $ (40,831) $ (380,071) $ (265,329) $ (145,333)
Capital Expenditures $ 174,624 $ 163,924 $ 339,862 $ 318,598 $ 160,935
Free Cash Flow(5) $ 137,856 $ 11,569 $ 344,309 $ 46,621 $ 230,854
Comparable Sales(6) (8)% (11)% (1)% 5% 7%
Net Store Sales Per Average Gross Square Foot $ 381 $ 417 $ 485 $ 463 $ 390
Total Number of Stores Open 969 1,006 1,041 1,045 1,069
Total Store Square Footage at End of Period 7,517 7,736 7,958 7,778 7,756
(1) Fiscal 2012 was a fifty-three week year.
(2) Working Capital is computed by subtracting current liabilities from current assets.
(3) Current Ratio is computed by dividing current assets by current liabilities.
(4) Return on Average Stockholders’ Equity is computed by dividing net income by the average stockholders’ equity balance.
(5) Free Cash Flow is computed by subtracting Capital Expenditures from the GAAP financial measure of Net Cash Provided by Operating Activities, both
of which are disclosed above in the table immediately preceding the measure of Free Cash Flow. The Company believes that the non-GAAP measure of
Free Cash Flow is useful to investors to understand available cash flows generated from operations less cash flows used for capital expenditures. The
closest GAAP financial measure is Net Cash Provided by Operating Activities. The non-GAAP financial measure of Free Cash Flow should not be used
in isolation or as an alternative to Net Cash Provided by Operating Activities or an indicator of the ongoing performance of the Company. It is also not
intended to supersede or replace the Company's GAAP financial measure.
(6) Comparable store sales is defined as year-over-year sales for a store that has been open as the same brand at least one year and its square footage has not
been expanded or reduced by more than 20% within the past year and prior year's net sales are converted at the current year's exchange rate to remove the
impact of currency fluctuation. Direct-to-Consumer comparable sales is defined as year-over-year sales with prior year's net sales converted at the current
year's exchange rate to remove the impact of currency fluctuation. Beginning with Fiscal 2012, comparable sales include comparable direct-to-consumer
sales. Figures for years prior to Fiscal 2012 have not been restated and only include comparable store sales.