Abercrombie & Fitch 2014 Annual Report Download - page 44
Download and view the complete annual report
Please find page 44 of the 2014 Abercrombie & Fitch annual report below. You can navigate through the pages in the report by either clicking on the pages listed below, or by using the keyword search tool below to find specific information within the annual report.-
 1
1 -
2
-
3
-
4
-
5
-
6
-
7
-
8
-
9
-
10
-
11
-
12
-
13
-
14
-
15
-
16
-
17
-
18
-
19
-
20
-
21
-
22
-
23
-
24
-
25
-
26
-
27
-
28
-
29
-
30
-
31
-
32
-
33
-
 34
34 -
 35
35 -
 36
36 -
 37
37 -
 38
38 -
 39
39 -
 40
40 -
 41
41 -
 42
42 -
 43
43 -
 44
44 -
 45
45 -
 46
46 -
 47
47 -
 48
48 -
 49
49 -
 50
50 -
 51
51 -
 52
52 -
 53
53 -
 54
54 -
55
-
56
-
57
-
58
-
59
-
60
-
61
-
62
-
63
-
64
-
65
-
66
-
67
-
68
-
69
-
70
-
71
-
72
-
73
-
74
-
75
-
76
-
77
-
78
-
79
-
80
-
81
-
82
-
83
-
84
-
85
-
86
-
87
-
88
-
89
 |
 |

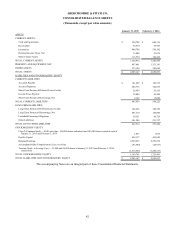
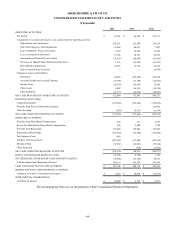
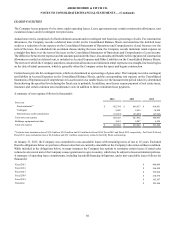
44
ABERCROMBIE & FITCH CO.
CONSOLIDATED STATEMENTS OF CASH FLOWS
(Thousands)
2014 2013 2012
OPERATING ACTIVITIES:
Net Income $ 51,821 $ 54,628 $ 237,011
Adjustments to reconcile net income to net cash provided by operating activities
Depreciation and Amortization 226,421 235,240 224,245
Non-Cash Charge for Asset Impairment 47,084 84,655 7,407
Loss on Disposal / Write-off of Assets 5,794 16,909 11,866
Lessor Construction Allowances 13,182 20,523 22,522
Amortization of Deferred Lease Credits (38,437) (45,895) (45,942)
Provision for (Benefit from) Deferred Income Taxes 1,676 (41,263) (21,543)
Share-Based Compensation 23,027 53,516 52,922
Gain on Auction Rate Securities — — (2,454)
Changes in Assets and Liabilities:
Inventories 62,854 (103,304) 253,650
Accounts Payable and Accrued Expenses (37,394) (73,749) (34,692)
Income Taxes (34,659) (55,456) 35,964
Other Assets 6,888 44,138 (34,318)
Other Liabilities (15,777) (14,449) (22,467)
NET CASH PROVIDED BY OPERATING ACTIVITIES 312,480 175,493 684,171
INVESTING ACTIVITIES:
Capital Expenditures (174,624) (163,924) (339,862)
Proceeds from Sales of Marketable Securities — — 101,963
Other Investing (450) (9,937) (9,339)
NET CASH USED FOR INVESTING ACTIVITIES (175,074) (173,861) (247,238)
FINANCING ACTIVITIES:
Proceeds from Share-Based Compensation 254 213 2,676
Excess Tax Benefit from Share-Based Compensation 304 2,480 1,198
Proceeds from Borrowings 357,000 150,000 135,000
Repayment of Borrowings (195,750) (15,000) (135,000)
Debt Issuance Costs (861) — —
Purchase of Treasury Stock (285,038) (115,806) (321,665)
Dividends Paid (57,362) (61,923) (57,634)
Other Financing — (795) (4,646)
NET CASH USED FOR FINANCING ACTIVITIES (181,453) (40,831) (380,071)
EFFECT OF EXCHANGE RATES ON CASH (35,361) (4,190) 3,148
NET (DECREASE) INCREASE IN CASH AND EQUIVALENTS: (79,408) (43,389) 60,010
Cash and Equivalents, Beginning of Period 600,116 643,505 583,495
CASH AND EQUIVALENTS, END OF PERIOD $ 520,708 $ 600,116 $ 643,505
SIGNIFICANT NON-CASH INVESTING ACTIVITIES:
Change in Accrual for Construction in Progress $ 6,525 $ 10,820 $ (12,919)
SUPPLEMENTAL INFORMATION:
Cash Paid for Interest $ 18,609 $ 4,565 $ 4,217
The accompanying Notes are an integral part of these Consolidated Financial Statements.