Abercrombie & Fitch 2014 Annual Report Download - page 31
Download and view the complete annual report
Please find page 31 of the 2014 Abercrombie & Fitch annual report below. You can navigate through the pages in the report by either clicking on the pages listed below, or by using the keyword search tool below to find specific information within the annual report.
31
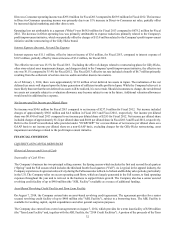
from the profit improvement initiative, were more than offset by the deleveraging effect of negative comparable sales and higher
direct-to-consumer expense.
Shipping and handling costs, including costs incurred to store, move and prepare merchandise for shipment and costs incurred to
physically move the merchandise to the customer, associated with direct-to-consumer operations were $93.4 million and $78.6
million for Fiscal 2013 and Fiscal 2012, respectively. The increase in shipping and handling costs in Fiscal 2013 was primarily
driven by increased sales volume and a higher international mix component. These amounts are recorded in Stores and Distribution
Expense in our Consolidated Statements of Operations and Comprehensive (Loss) Income.
Handling costs, including costs incurred to store, move and prepare merchandise for shipment to stores were $53.9 million and
$59.4 million for Fiscal 2013 and Fiscal 2012, respectively. These amounts are recorded in Stores and Distribution Expense in
our Consolidated Statements of Operations and Comprehensive (Loss) Income.
Marketing, General and Administrative Expense
Marketing, general and administrative expense was $481.8 million for Fiscal 2013 compared to $473.9 million for Fiscal 2012.
Marketing, general and administrative expense for Fiscal 2013 included $12.7 million in charges related to the profit improvement
initiative. Excluding these charges, marketing, general and administrative expense was $469.1 million for Fiscal 2013.
Restructuring Charges
On November 1, 2013, A&F’s Board of Directors approved the closure of the Company’s 24 stand-alone Gilly Hicks branded
stores. In connection with the strategic review, the Company decided to focus the future development of the Gilly Hicks brand
through Hollister stores and direct-to-consumer channels. Restructuring charges associated with the store closures for the full year
were $81.5 million, of which $42.7 million related to lease terminations and store closure costs and $37.9 million for asset
impairments.
Asset Impairment
The Company recorded asset impairment charges of $46.7 million for Fiscal 2013 primarily related to 97 stores, and $7.4 million
for Fiscal 2012 primarily related to 17 stores.
Other Operating Expense (Income), Net
Other operating income, net was $23.1 million for Fiscal 2013 compared to other operating expense, net of $19.3 million for Fiscal
2012. Other operating income, net included income of $9.0 million and $4.8 million related to insurance recoveries for Fiscal
2013 and Fiscal 2012, respectively.
Operating Income
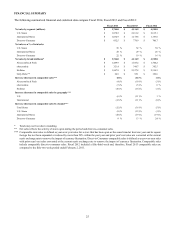
Operating income was $80.8 million for Fiscal 2013 compared to operating income of $374.2 million for Fiscal 2012. Adjusted
non-GAAP operating income was $222.9 million for Fiscal 2013 was compared to adjusted non-GAAP operating income of $381.6
million for Fiscal 2012, excluding pre-tax charges for Gilly Hicks restructuring, asset impairment and the profit improvement
initiative for Fiscal 2013 and Fiscal 2012 of $142.1 million and $7.4 million, respectively. The decrease in adjusted non-GAAP
operating income excluding charges was primarily driven by the deleveraging effect of negative comparable store sales, both U.S.
and international, partially offset by new international stores, direct-to-consumer operations and expense reductions primarily
related to the Company's profit improvement initiative.
U.S. Stores operating income was $194.6 million for Fiscal 2013 compared to $432.0 million for Fiscal 2012. The decrease in
U.S. Stores operating income was primarily due to a 15% decrease in comparable U.S. Stores sales, which had a deleveraging
effect, and incremental charges of $87.5 million for Fiscal 2013 as compared to Fiscal 2012 related to the restructuring of the Gilly
Hicks brand, store-related asset impairment and the Company's profit improvement initiative, partially offset by expense reductions
primarily related to the Company's profit improvement initiative.
International Stores operating income was $249.3 million for Fiscal 2013 compared to $350.9 million for Fiscal 2012. The decrease
in International Stores operating income was primarily due to a 19% decrease in comparable International Stores sales, which had
a deleveraging effect, increased promotional activity and charges of $33.3 million related to the restructuring of the Gilly Hicks
brand and store-related asset impairment, partially offset by expense reductions primarily related to the Company's profit
improvement initiative and net opening of 24 stores.


