Abercrombie & Fitch 2014 Annual Report Download - page 32
Download and view the complete annual report
Please find page 32 of the 2014 Abercrombie & Fitch annual report below. You can navigate through the pages in the report by either clicking on the pages listed below, or by using the keyword search tool below to find specific information within the annual report.-
 1
1 -
2
-
3
-
4
-
5
-
6
-
7
-
8
-
9
-
10
-
11
-
12
-
13
-
14
-
15
-
16
-
17
-
18
-
19
-
20
-
21
-
 22
22 -
 23
23 -
 24
24 -
 25
25 -
 26
26 -
 27
27 -
 28
28 -
 29
29 -
 30
30 -
 31
31 -
 32
32 -
 33
33 -
 34
34 -
 35
35 -
 36
36 -
 37
37 -
 38
38 -
 39
39 -
 40
40 -
 41
41 -
 42
42 -
43
-
44
-
45
-
46
-
47
-
48
-
49
-
50
-
51
-
52
-
53
-
54
-
55
-
56
-
57
-
58
-
59
-
60
-
61
-
62
-
63
-
64
-
65
-
66
-
67
-
68
-
69
-
70
-
71
-
72
-
73
-
74
-
75
-
76
-
77
-
78
-
79
-
80
-
81
-
82
-
83
-
84
-
85
-
86
-
87
-
88
-
89
 |
 |

32
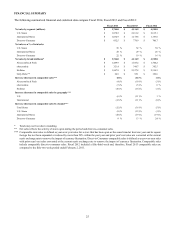
Direct-to-Consumer operating income was $295.0 million for Fiscal 2013 compared to $269.5 million for Fiscal 2012. The increase
in Direct-to-Consumer operating income was primarily due to an 11% increase in Direct-to-Consumer net sales, partially offset
by increased digital marketing and other direct costs.
Operating loss not attributable to a segment ("Other") was $658.0 million for Fiscal 2013 compared to $678.2 million for Fiscal
2012. The decrease in Other operating loss was primarily attributable to expense reductions primarily related to the Company's
profit improvement initiative, which was partially offset by charges of $13.8 million related to the Company's profit improvement
initiative and the restructuring of the Gilly Hicks brand.
Interest Expense (Income), Net and Tax Expense
Interest expense was $11.1 million, offset by interest income of $3.6 million, for Fiscal 2013, compared to interest expense of
$10.5 million, partially offset by interest income of $3.2 million, for Fiscal 2012.
The effective tax rate was 25.5% for Fiscal 2013. Excluding the effect of charges related to restructuring plans for Gilly Hicks,
other store-related asset impairment charges, and charges related to the Company’s profit improvement initiative, the effective tax
rate was 30.1% compared to 35.4% for Fiscal 2012. The Fiscal 2013 effective tax rate included a benefit of $6.7 million primarily
resulting from the settlement of certain state tax audits and other discrete tax matters.
As of February 1, 2014, there were approximately $15.8 million of net deferred tax assets in Japan. The realization of the net
deferred tax assets will depend upon the future generation of sufficient taxable profits in Japan. While the Company believes it is
more likely than not that the net deferred tax assets will be realized, it is not certain. Should circumstances change, the net deferred
tax assets not currently subject to a valuation allowance may become subject to one in the future. Additional valuation allowances
would result in additional tax expense.
Net Income and Net Income per Diluted Share
Net income was $54.6 million for Fiscal 2013 compared to net income of $237.0 million for Fiscal 2012. Net income included
charges of approximately $96.0 million and $4.6 million in Fiscal 2013 and Fiscal 2012, respectively. Net income per diluted
share was $0.69 for Fiscal 2013 compared to net income per diluted share of $2.85 for Fiscal 2012. Net income per diluted share
included charges of approximately $1.22 per diluted share and $0.06 per diluted share in Fiscal 2013 and Fiscal 2012, respectively.
Refer to the GAAP reconciliation table provided under "OVERVIEW" for a reconciliation of net income per diluted share on a
GAAP basis to net income per diluted share on a non-GAAP basis, excluding charges for the Gilly Hicks restructuring, asset
impairment and charges related to the profit improvement initiative.
FINANCIAL CONDITION
LIQUIDITY AND CAPITAL RESOURCES
Historical Sources and Uses of Cash
Seasonality of Cash Flows
The Company’s business has two principal selling seasons: the Spring season which includes the first and second fiscal quarters
(“Spring”) and the Fall season which includes the third and fourth fiscal quarters ("Fall"). As is typical in the apparel industry, the
Company experiences its greatest sales activity during the Fall season due to Back-to-School and Holiday sales periods, particularly
in the U.S. The Company relies on excess operating cash flows, which are largely generated in the Fall season, to fund operating
expenses throughout the year and to reinvest in the business to support future growth. The Company also has a senior secured
revolving credit facility of up to $400 million (the "ABL Facility") available as a source of additional funding.
Asset-Based Revolving Credit Facility and Term Loan Facility
On August 7, 2014, the Company entered into an asset-based revolving credit agreement. The agreement provides for a senior
secured revolving credit facility of up to $400 million (the "ABL Facility"), subject to a borrowing base. The ABL Facility is
available for working capital, capital expenditures and other general corporate purposes.
The Company also entered into a term loan agreement on August 7, 2014, which provides for a term loan facility of $300 million
(the "Term Loan Facility" and, together with the ABL Facility, the "2014 Credit Facilities"). A portion of the proceeds of the Term