Abercrombie & Fitch 2014 Annual Report Download - page 27
Download and view the complete annual report
Please find page 27 of the 2014 Abercrombie & Fitch annual report below. You can navigate through the pages in the report by either clicking on the pages listed below, or by using the keyword search tool below to find specific information within the annual report.-
 1
1 -
2
-
3
-
4
-
5
-
6
-
7
-
8
-
9
-
10
-
11
-
12
-
13
-
14
-
15
-
16
-
 17
17 -
 18
18 -
 19
19 -
 20
20 -
 21
21 -
 22
22 -
 23
23 -
 24
24 -
 25
25 -
 26
26 -
 27
27 -
 28
28 -
 29
29 -
 30
30 -
 31
31 -
 32
32 -
 33
33 -
 34
34 -
 35
35 -
 36
36 -
 37
37 -
38
-
39
-
40
-
41
-
42
-
43
-
44
-
45
-
46
-
47
-
48
-
49
-
50
-
51
-
52
-
53
-
54
-
55
-
56
-
57
-
58
-
59
-
60
-
61
-
62
-
63
-
64
-
65
-
66
-
67
-
68
-
69
-
70
-
71
-
72
-
73
-
74
-
75
-
76
-
77
-
78
-
79
-
80
-
81
-
82
-
83
-
84
-
85
-
86
-
87
-
88
-
89
 |
 |

27
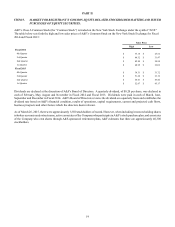
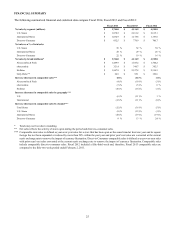
KEY BUSINESS INDICATORS
The following measurements are among the key business indicators reviewed by various members of management to gauge the
Company’s results:
• Comparable store sales, defined as year-over-year sales for a store that has been open as the same brand at least one year
and its square footage has not been expanded or reduced by more than 20% within the past year, and with prior year's net
sales converted at the current year's exchange rate to remove the impact of currency fluctuation;
• Comparable direct-to-consumer sales, defined as year-over-year sales with prior year's net sales converted at the current
year's exchange rate to remove the impact of currency fluctuation;
• Comparable sales, defined as comparable store sales combined with comparable direct-to-consumer sales;
• U.S. and International store performance;
• Store productivity;
• Gross margin;
• Selling margin, defined as sales price less original cost, by brand and by product category;
• Stores and distribution expense as a percentage of net sales;
• Marketing, general and administrative expense as a percentage of net sales;
• Operating income and operating income as a percentage of net sales;
• Net income;
• Inventory per gross square foot and inventory to sales ratio;
• Cash flow and liquidity determined by the Company’s working capital and free cash flow;
• Store metrics such as sales per gross square foot, sales per selling square foot, average unit retail, average number of
transactions per store, average units per transaction, average transaction values, and store contribution (defined as store
sales less direct costs of operating the store); and,
• Return on invested capital and return on equity.
While not all of these metrics are disclosed publicly by the Company due to the proprietary nature of the information, the Company
publicly discloses and discusses many of these metrics as part of its “Financial Summary” and in several sections within this
Management’s Discussion and Analysis of Financial Condition and Results of Operations.
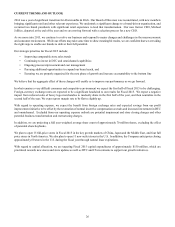
RESULTS OF OPERATIONS
FISCAL 2014 COMPARED TO FISCAL 2013
Net Sales
Net sales for Fiscal 2014 were $3.744 billion, a decrease of 9% from Fiscal 2013 net sales of $4.117 billion. The net sales decrease
was attributable to an 8% decrease in comparable sales, which equated to a 7% decrease in net sales, 37 net store closures and the
adverse effects of changes in foreign currency exchange rates (based on converting prior year sales at current year exchange rates)
of approximately $19.2 million.
U. S. Stores net sales for Fiscal 2014 were $1.879 billion, a decrease of 13% from Fiscal 2013 U.S. Stores net sales of $2.161
billion. The decrease in U.S. Stores net sales was primarily due to a 9% decrease in comparable U.S. Stores sales, which equated
into an 8% decrease in U.S. Stores net sales, and a 5% decrease in U.S. Stores sales attributable to net closure of 44 stores.
International Stores net sales for Fiscal 2014 were $1.033 billion, a decrease of 12% from Fiscal 2013 International Stores net
sales of $1.179 billion. The decrease in International Stores net sales was primarily due to an 18% decrease in comparable
International Stores sales, which equated into an 16% decrease in International Stores net sales, and the adverse effects of changes
in foreign currency exchange rates of approximately $10.0 million, which were partially offset by a 5% increase in International
Stores net sales attributable to net opening of 7 stores.
Direct-to-Consumer net sales for Fiscal 2014, including shipping and handling revenue, were $832.5 million, an increase of 7%
from Fiscal 2013 Direct-to-Consumer net sales of $776.9 million. The increase in Direct-to-Consumer net sales was primarily due
to an 11% increase in comparable international Direct-to-Consumer sales and a 6% increase in comparable U.S. Direct-to-Consumer
sales, which together equated into an 8% increase in Direct-to-Consumer net sales, partially offset by the adverse effects of changes
in foreign currency exchange rates of approximately $9.2 million . The Direct-to-Consumer business, including shipping and
handling revenue, accounted for 22% of total net sales in Fiscal 2014 compared to 19% in Fiscal 2013.