Abercrombie & Fitch 2014 Annual Report Download - page 24
Download and view the complete annual report
Please find page 24 of the 2014 Abercrombie & Fitch annual report below. You can navigate through the pages in the report by either clicking on the pages listed below, or by using the keyword search tool below to find specific information within the annual report.-
 1
1 -
2
-
3
-
4
-
5
-
6
-
7
-
8
-
9
-
10
-
11
-
12
-
13
-
 14
14 -
 15
15 -
 16
16 -
 17
17 -
 18
18 -
 19
19 -
 20
20 -
 21
21 -
 22
22 -
 23
23 -
 24
24 -
 25
25 -
 26
26 -
 27
27 -
 28
28 -
 29
29 -
 30
30 -
 31
31 -
 32
32 -
 33
33 -
 34
34 -
35
-
36
-
37
-
38
-
39
-
40
-
41
-
42
-
43
-
44
-
45
-
46
-
47
-
48
-
49
-
50
-
51
-
52
-
53
-
54
-
55
-
56
-
57
-
58
-
59
-
60
-
61
-
62
-
63
-
64
-
65
-
66
-
67
-
68
-
69
-
70
-
71
-
72
-
73
-
74
-
75
-
76
-
77
-
78
-
79
-
80
-
81
-
82
-
83
-
84
-
85
-
86
-
87
-
88
-
89
 |
 |

24
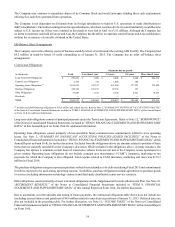
profit improvement initiative, and corporate governance matters. These non-GAAP financial measures should not be used as
alternatives to operating income, net income or net income per diluted share and are also not intended to be indicators of the
ongoing operating performance of the Company or to supersede or replace the Company's GAAP financial measures.
The table below reconciles the GAAP financial measures to the non-GAAP financial measures for the fiscal years ended January 31,
2015, February 1, 2014 and February 2, 2013.
(in thousands, except per share amounts)
Fiscal 2014 Fiscal 2013 Fiscal 2012
Operating
Income Net Income
Net Income
per Diluted
Share(2) Operating
Income Net Income
Net Income
per Diluted
Share(2) Operating
Income Net Income
Net Income
per Diluted
Share(2)
GAAP $ 113,519 $ 51,821 $ 0.71 $ 80,823 $ 54,628 $ 0.69 $ 374,233 $ 237,011 $ 2.85
Excluded
Charges (1) 78,174 60,488 0.83 142,054 95,991 1.22 7,407 4,592 0.06
Non-GAAP $ 191,693 $ 112,309 $ 1.54 $ 222,877 $ 150,619 $ 1.91 $ 381,640 $ 241,603 $ 2.90
(1) Excluded charges for Fiscal 2014 included $45.0 million in pre-tax charges related to asset impairment, $12.7 million in pre-tax charges related to certain
corporate governance matters and CEO transition costs, $8.4 million in pre-tax charges related to the restructuring of the Gilly Hicks brand, $6.5 million
in pre-tax charges related to the Company's profit improvement initiative and $5.6 million in pre-tax charges related to lease terminations and store closures.
Excluded charges for Fiscal 2013 included $81.5 million in pre-tax charges related to the restructuring of the Gilly Hicks brand, $46.7 million in pre-tax
charges related to asset impairment and $13.8 million in pre-tax charges related to the Company's profit improvement initiative. Excluded charges for
Fiscal 2012 include $7.4 million in pre-tax charges related to asset impairments.
(2) Adjusted non-GAAP net income per diluted share is based on diluted weighted-average shares outstanding of 72.9 million, 78.7 million and 83.2 million
for Fiscal 2014, Fiscal 2013 and Fiscal 2012, respectively.
As of January 31, 2015, the Company had $520.7 million in cash and equivalents, and $299.3 million in gross borrowings
outstanding under its term loan facility. Net cash provided by operating activities, the Company's primary source of liquidity, was
$312.5 million for Fiscal 2014. The Company used cash of $174.6 million for capital expenditures, $285.0 million to repurchase
approximately 7.3 million shares of A&F's Common Stock and $57.4 million to pay dividends during Fiscal 2014. In addition,
the Company had net proceeds from borrowings of $161.3 million during Fiscal 2014.
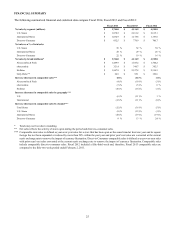
The following data represents the amounts shown in the Company’s Consolidated Statements of Operations and Comprehensive
(Loss) Income for the last three fiscal years, expressed as a percentage of net sales:
Fiscal 2014 Fiscal 2013 Fiscal 2012
NET SALES 100.0% 100.0% 100.0%
Cost of Goods Sold 38.2% 37.4% 37.6%
GROSS PROFIT 61.8% 62.6% 62.4%
Stores and Distribution Expense 45.5% 46.3% 43.9%
Marketing, General and Administrative Expense 12.3% 11.7% 10.5%
Restructuring Charges 0.2% 2.0% —%
Asset Impairment 1.2% 1.1% 0.2%
Other Operating Income, Net (0.4)% (0.6)% (0.4)%
OPERATING INCOME 3.0% 2.0% 8.3%
Interest Expense, Net 0.4% 0.2% 0.2%
INCOME BEFORE TAXES 2.6% 1.8% 8.1%
Tax Expense 1.3% 0.5% 2.9%
NET INCOME 1.4% 1.3% 5.3%