Abercrombie & Fitch 2014 Annual Report Download - page 70
Download and view the complete annual report
Please find page 70 of the 2014 Abercrombie & Fitch annual report below. You can navigate through the pages in the report by either clicking on the pages listed below, or by using the keyword search tool below to find specific information within the annual report.-
 1
1 -
2
-
3
-
4
-
5
-
6
-
7
-
8
-
9
-
10
-
11
-
12
-
13
-
14
-
15
-
16
-
17
-
18
-
19
-
20
-
21
-
22
-
23
-
24
-
25
-
26
-
27
-
28
-
29
-
30
-
31
-
32
-
33
-
34
-
35
-
36
-
37
-
38
-
39
-
40
-
41
-
42
-
43
-
44
-
45
-
46
-
47
-
48
-
49
-
50
-
51
-
52
-
53
-
54
-
55
-
56
-
57
-
58
-
59
-
 60
60 -
 61
61 -
 62
62 -
 63
63 -
 64
64 -
 65
65 -
 66
66 -
 67
67 -
 68
68 -
 69
69 -
 70
70 -
 71
71 -
 72
72 -
 73
73 -
 74
74 -
 75
75 -
 76
76 -
 77
77 -
 78
78 -
 79
79 -
 80
80 -
81
-
82
-
83
-
84
-
85
-
86
-
87
-
88
-
89
 |
 |

ABERCROMBIE & FITCH CO.
NOTES TO CONSOLIDATED FINANCIAL STATEMENTS — (Continued)
70
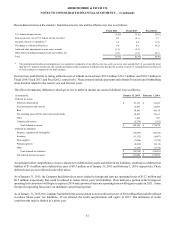
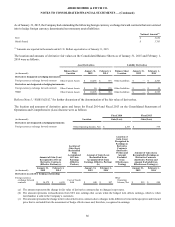
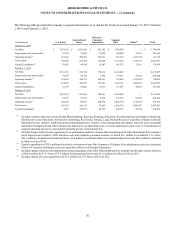
The following table provides the Company’s segment information as of, and for the fiscal years ended January 31, 2015, February
1, 2014 and February 2, 2013.
(in thousands) U.S. Stores International
Stores
Direct-to-
Consumer
Operations Segment
Total Other(1) Total
January 31, 2015
Net Sales $ 1,878,542 $ 1,032,946 $ 832,542 $ 3,744,030 — $ 3,744,030
Depreciation and Amortization 55,339 98,243 16,298 169,880 56,541 226,421
Operating Income(2) 261,446 204,262 269,564 735,272 (621,753) 113,519
Total Assets 349,088 616,336 150,228 1,115,652 1,389,515 2,505,167
Capital Expenditures(3) 41,887 44,429 55,007 141,323 33,301 174,624
February 1, 2014
Net Sales 2,161,183 1,178,798 776,916 4,116,897 — 4,116,897
Depreciation and Amortization 75,297 92,474 7,850 175,621 59,619 235,240
Operating Income(4) 194,582 249,331 294,951 738,864 (658,041) 80,823
Total Assets 414,463 805,257 122,381 1,342,101 1,508,896 2,850,997
Capital Expenditures 18,599 82,805 15,633 117,037 46,887 163,924
February 2, 2013
Net Sales 2,615,138 1,195,016 700,651 4,510,805 — 4,510,805
Depreciation and Amortization 94,367 67,972 5,198 167,537 56,708 224,245
Operating Income(5) 432,040 350,871 269,479 1,052,390 (678,157) 374,233
Total Assets 587,334 840,317 63,063 1,490,714 1,496,687 2,987,401
Capital Expenditures 3,016 218,933 22,567 244,516 95,346 339,862
(1) Includes corporate functions such as Design, Merchandising, Sourcing, Planning, Allocation, Store Management and Support, Marketing,
Distribution Center Operations, Information Technology, Real Estate, Finance, Legal, Human Resources and other corporate overhead.
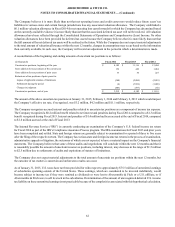
Operating Income includes: marketing, general and administrative expense; store management and support functions such as regional
and district management and other functions not dedicated to an individual store; as well as distribution center costs. A reconciliation of
segment operating income to consolidated operating income is provided below.
(2) Includes charges related to asset impairment, lease terminations and store closures, the restructuring of the Gilly Hicks brand, the Company's
profit improvement initiative, CEO transition costs and corporate governance matters of which $6.1 million is included in U.S. stores,
$43.6 million is included in International Stores, $0.4 million is included in Direct-to-Consumer Operations and $28.1 million is included
in Other for Fiscal 2014.
(3) Capital expenditures of $35.6 million related to the conversion of one of the Company's Columbus, Ohio distribution centers to a dedicated
Direct-to-Consumer distribution center are included in Direct-to-Consumer Operations.
(4) Includes charges related to asset impairment, restructuring plans of the Gilly Hicks brand and the Company's profit improvement initiative
of $94.9 million for U.S. Stores, $33.3 million for International Stores and $13.8 million for Other for Fiscal 2013.
(5) Includes charges for asset impairments of $7.4 million for U.S. Stores for Fiscal 2012.