Abercrombie & Fitch 2012 Annual Report Download - page 59
Download and view the complete annual report
Please find page 59 of the 2012 Abercrombie & Fitch annual report below. You can navigate through the pages in the report by either clicking on the pages listed below, or by using the keyword search tool below to find specific information within the annual report.-
 1
1 -
2
-
3
-
4
-
5
-
6
-
7
-
8
-
9
-
10
-
11
-
12
-
13
-
14
-
15
-
16
-
17
-
18
-
19
-
20
-
21
-
22
-
23
-
24
-
25
-
26
-
27
-
28
-
29
-
30
-
31
-
32
-
33
-
34
-
35
-
36
-
37
-
38
-
39
-
40
-
41
-
42
-
43
-
44
-
45
-
46
-
47
-
48
-
 49
49 -
 50
50 -
 51
51 -
 52
52 -
 53
53 -
 54
54 -
 55
55 -
 56
56 -
 57
57 -
 58
58 -
 59
59 -
 60
60 -
 61
61 -
 62
62 -
 63
63 -
 64
64 -
 65
65 -
 66
66 -
 67
67 -
 68
68 -
 69
69 -
70
-
71
-
72
-
73
-
74
-
75
-
76
-
77
-
78
-
79
-
80
-
81
-
82
-
83
-
84
-
85
-
86
-
87
-
88
-
89
 |
 |

Table of Contents
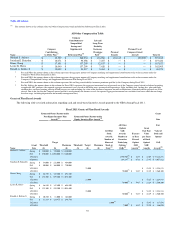
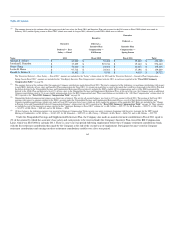
EXECUTIVE OFFICER COMPENSATION
Summary Compensation Table
The following table summarizes the compensation paid to, awarded to or earned by the NEOs for Fiscal 2011, Fiscal 2010 and Fiscal 2009 in
accordance with the rules promulgated by the SEC effective as of February 28, 2010.
Fiscal 2011 Summary Compensation Table
Name and Principal Position
During Fiscal 2011
Fiscal
Year
Salary
($)
Bonus
($)
Stock
Awards
($)(1)
Option/SAR
Awards
($)(1)
Non-Equity
Incentive Plan
Compensation
($)(2)
Change in
Pension
Value and
Nonqualified
Deferred
Compensation
Earnings ($)(3)
All Other
Compensation
($)(4)
Total
($)
Michael S. Jeffries 2011 $ 1,500,000 $ — $ — $ 43,201,893 $ 1,188,000 $ 1,460,398 $ 719,182 $ 48,069,473
Chairman and Chief 2010 $ 1,500,000 $ — $ — $ 14,071,661 $ 2,329,200 $ 734,122 $ 4,609,925 $ 23,244,908
Executive Officer 2009 $ 1,500,000 $ — $ — $ 33,293,108 $ — $ 15,545 $ 1,526,991 $ 36,335,644
Jonathan E. Ramsden 2011 $ 745,192 $ — $ 1,224,833 $ 1,560,300 $ 382,800 $ 10,616 $ 119,426 $ 4,043,167
Executive Vice President 2010 $ 717,308 $ — $ — $ 2,378,600 $ 697,913 $ 2 $ 55,729 $ 3,849,552
and Chief Financial Officer 2009 $ 700,000 $ — $ — $ — $ — $ — $ 43,859 $ 743,859
Diane Chang 2011 $ 977,116 $ — $ 1,224,833 $ 1,560,300 $ 573,210 $ 38,751 $ 167,827 $ 4,542,037
Executive Vice President — 2010 $ 955,246 $ — $ — $ 2,378,600 $ 1,053,212 $ 779 $ 109,635 $ 4,497,472
Sourcing 2009 $ 923,446 $ — $ — $ 1,408,400 $ — $ 3,805 $ 198,959 $ 2,534,610
Leslee K. Herro 2011 $ 977,116 $ — $ 1,224,833 $ 1,560,300 $ 573,210 $ 57,166 $ 162,965 $ 4,555,590
Executive Vice President — 2010 $ 955,246 $ — $ — $ 2,378,600 $ 1,053,212 $ 1,187 $ 109,008 $ 4,497,253
Planning and Allocation 2009 $ 923,446 $ — $ — $ 1,408,400 $ — $ 5,757 $ 197,103 $ 2,534,706
Ronald A. Robins, Jr. 2011 $ 460,096 $ — $ 317,676 $ 156,030 $ 133,650 $ 992 $ 40,079 $ 1,108,523
Senior Vice President, 2010 $ 429,077 $ — $ — $ — $ 216,048 $ 1 $ 22,620 $ 667,746
General Counsel and Secretary 2009 $ — $ — $ — $ — $ — $ — $ — $ —
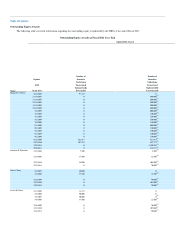
(1) The amounts included in the "Stock Awards" and "Option/SAR Awards" columns represent the grant date fair value related to restricted stock unit awards and SAR grants to the NEOs,
computed in accordance with U.S. generally accepted accounting principles. The SARs that were granted to the NEOs will only deliver monetary value if the price of the Company's
Common Stock increases beyond the grant price after the awards vest. For a discussion of valuation assumptions, see "Note 4. Share-Based Compensation" of the Notes to Consolidated
Financial Statements included in "ITEM 8. FINANCIAL STATEMENTS AND SUPPLEMENTARY DATA" of the Company's Fiscal 2011 Form 10-K. The actual number of equity
awards granted in Fiscal 2011 is shown in the "Fiscal 2011 Grants of Plan-Based Awards" table beginning on page 57. Pursuant to applicable SEC Rules, the amounts shown exclude
the impact of estimated forfeitures related to service-based vesting conditions. In addition, in accordance with U.S. generally accepted accounting principles, the fair value of a stock
option, a SAR or a restricted stock unit granted to a retirement-eligible associate will be expensed earlier than a stock option, a SAR or a restricted stock unit granted to an associate who
is not retirement eligible. These amounts do not necessarily reflect the actual value received or to be received by the NEOs.
(2) Represents the aggregate of the performance-based incentive cash compensation for Spring and Fall selling seasons for each individual.
(3) For all NEOs other than Mr. Jeffries, the amounts shown in this column for Fiscal 2011, Fiscal 2010 and Fiscal 2009 represent the above-market earnings on their respective Nonqualified
Savings and Supplemental Retirement Plan balances. Above market-earnings is defined as earnings in excess of 120% of the monthly applicable federal long-term rate (AFR). The AFR
for January 2012 was 3.11%.
For Mr. Jeffries, (i) the amount shown in this column for Fiscal 2011 represents above-market earnings of $147,088 on his Nonqualified Savings and Supplemental Retirement Plan
balance plus the increase in actuarial present value of $1,313,310 in respect of Mr. Jeffries' accumulated benefit under the Chief Executive Officer Supplemental Executive Retirement
Plan; (ii) the amount shown in this column for Fiscal 2010 represents above-market earnings of $3,137 on his Nonqualified Savings and Supplemental Retirement Plan balance plus the
increase in actuarial present value of $730,985 in respect of his accumulated benefit under the Chief Executive Officer Supplemental Executive Retirement Plan; and (iii) the amount
shown in this column for Fiscal 2009 represents above-market earnings of $15,545 on his Nonqualified Savings and Supplemental Retirement Plan balance but does not include the
decrease in actuarial present value of $2,634,611 in respect of his accumulated benefit under the Chief Executive Officer Supplemental Executive Retirement Plan (which decrease was
primarily due to a decrease in the preceding 36-month average compensation, partially offset by a decrease in the discount rate used in the calculation to determine such benefit).
56