ADT 2000 Annual Report Download - page 70
Download and view the complete annual report
Please find page 70 of the 2000 ADT annual report below. You can navigate through the pages in the report by either clicking on the pages listed below, or by using the keyword search tool below to find specific information within the annual report.-
 1
1 -
2
-
3
-
4
-
5
-
6
-
7
-
8
-
9
-
10
-
11
-
12
-
13
-
14
-
15
-
16
-
17
-
18
-
19
-
20
-
21
-
22
-
23
-
24
-
25
-
26
-
27
-
28
-
29
-
30
-
31
-
32
-
33
-
34
-
35
-
36
-
37
-
38
-
39
-
40
-
41
-
42
-
43
-
44
-
45
-
46
-
47
-
48
-
49
-
50
-
51
-
52
-
53
-
54
-
55
-
56
-
57
-
58
-
59
-
 60
60 -
 61
61 -
 62
62 -
 63
63 -
 64
64 -
 65
65 -
 66
66 -
 67
67 -
 68
68 -
 69
69 -
 70
70 -
 71
71 -
 72
72 -
 73
73 -
 74
74 -
 75
75 -
 76
76
 |
 |

SIXTY EIGHT
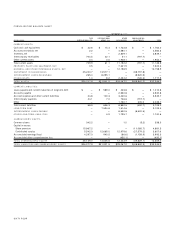
CONSOLIDATING STATEMENT OF CASH FLOWS
YEAR ENDED SEPTEMBER 3 0 , 19 98
TYCO
TYCO INTERNATIONAL OTHER CONSOLIDATI N G
(I N MILLI ONS) INTERN ATIONAL LTD. GROUP, S.A. SU BSIDIARIES ADJUSTMENTS TOTAL
CASH FLOWS FROM OPERATING ACTIVITIES:
Net cash provided by (used in) operating activities $ 177.8 $ (5.8) $ 2,109.8 $
—
$ 2,281.8
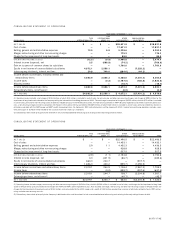
CASH FLOWS FROM INVESTING ACTIVITIES:
Purchase of property, plant and equipment, net
——
(1,317.5)
—
(1,317.5)
Acquisition of businesses, net of cash acquired
——
(4,251.8)
—
(4,251.8)
Net decrease (increase) in investments 65.3
—
(58.9)
—
6.4
(Increase) in intercompany loans
—
(4,090.9)
—
4,090.9
—
(Increase) in investment in subsidiaries (1,805.2) (1,110.7)
—
2,915.9
—
Other
——
(83.1)
—
(83.1)
Net cash utilized by investing activities (1,739.9) (5,201.6) (5,711.3) 7,006.8 (5,646.0)
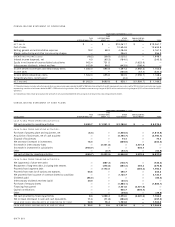
CASH FLOWS FROM FINANCING ACTIVITIES:
Net receipts of short-term debt
——
287.1
—
287.1
Net proceeds from issuance of public debt
—
2,744.5
——
2,744.5
Repayment of long-term debt, including debt tenders
——
(2,214.5) 1,139.9 (1,074.6)
Proceeds from long-term debt
—
1,358.9 583.0 (1,139.9) 802.0
Proceeds from the sale of common shares 1,245.0
———
1,245.0
Proceeds from exercise of options and warrants 304.9
—
43.8
—
348.7
Dividends paid (56.5)
—
(246.5)
—
(303.0)
Purchase of treasury shares
——
(283.9)
—
(283.9)
Financing from parent
——
4,090.9 (4,090.9)
—
Capital contributions
—
1,110.7 1,805.2 (2,915.9)
—
Other
——
(36.5)
—
(36.5)
Net cash provided by financing activities 1,493.4 5,214.1 4,028.6 (7,006.8) 3,729.3
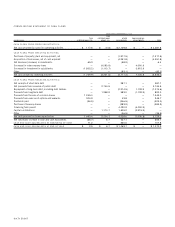
Net (decrease) increase in cash and cash equivalents (68.7) 6.7 427.1
—
365.1
CASH AND CASH EQUIVALENTS AT BEGINNING OF YEAR 71.2
—
636.6
—
707.8
CASH AND CASH EQUIVALENTS AT END OF YEAR $ 2.5 $ 6.7 $ 1,063.7 $
—
$ 1,072.9