ADT 2000 Annual Report Download - page 62
Download and view the complete annual report
Please find page 62 of the 2000 ADT annual report below. You can navigate through the pages in the report by either clicking on the pages listed below, or by using the keyword search tool below to find specific information within the annual report.-
 1
1 -
2
-
3
-
4
-
5
-
6
-
7
-
8
-
9
-
10
-
11
-
12
-
13
-
14
-
15
-
16
-
17
-
18
-
19
-
20
-
21
-
22
-
23
-
24
-
25
-
26
-
27
-
28
-
29
-
30
-
31
-
32
-
33
-
34
-
35
-
36
-
37
-
38
-
39
-
40
-
41
-
42
-
43
-
44
-
45
-
46
-
47
-
48
-
49
-
50
-
51
-
 52
52 -
 53
53 -
 54
54 -
 55
55 -
 56
56 -
 57
57 -
 58
58 -
 59
59 -
 60
60 -
 61
61 -
 62
62 -
 63
63 -
 64
64 -
 65
65 -
 66
66 -
 67
67 -
 68
68 -
 69
69 -
 70
70 -
 71
71 -
 72
72 -
73
-
74
-
75
-
76
 |
 |

SIXTY
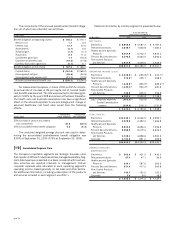
The components of the accrued postretirement benefit obliga-
tion, all of which are unfunded, are as follows:
(I N MILLI ONS) 2 0 0 0 1 9 9 9
Benefit obligation at beginning of year $ 1 6 8 .2 $ 174.1
Service cost 1 .1 3.5
Interest cost 1 2 .7 12.0
Amendments (3 .1 ) 4.5
Actuarial gain (1 .7 ) (4.1)
Acquisition 8 .4 11.2
Curtailment gain (loss) 1 .7 (15.3)
Expected net benefits paid (1 9 .6 ) (17.8)
Currency fluctuation (gain) loss (0 .1 ) 0.1
Benefit obligation at end of year $ 1 6 7 .6 $ 168.2
Funded status $ (1 6 7 .6 ) $(168.2)
Unrecognized net gain (2 9 .6 ) (24.5)
Unrecognized prior service cost (1 1 .1 ) (13.8)
Accrued postretirement benefit cost $ (2 0 8 .3 ) $(206.5)
For measurement purposes, in Fiscal 2000, an 8.15% compos-
ite annual rate of increase in the per capita cost of covered health
care benefits was assumed. The rate was assumed to decrease grad-
ually to 5.00% by the year 2008 and remain at that level thereafter.
The health care cost trend rate assumption may have a significant
effect on the amounts reported. A one-percentage-point change in
assumed healthcare cost trend rates would have the following
effects:
1 -PERCENTAGE- 1 -PERCEN TAGE-
(I N MILLI ONS) POINT INCREASE POINT DECREASE
Effect on total of service and interest
cost components $ 0 .5 $ (0 .5 )
Effect on postretirement benefit obligation 6 .2 (5 .4 )
The combined weighted average discount rate used in deter-
mining the accumulated postretirement benefit obligation was
8.00% at September 30, 2000 (7.75% at September 30, 1999).
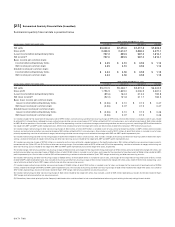
[1 9 ] Consolidated Segment Data
The Company’s reportable segments are strategic business units
that operate in different industries and are managed separately. Seg-
ment data have been presented on a basis consistent with how busi-
ness activities are reported internally to management. Certain
corporate expenses were allocated to each operating segment’s
operating income, based generally on net sales and other factors.
For additional information, including a description of the products
and services included in each segment, see Note 1.
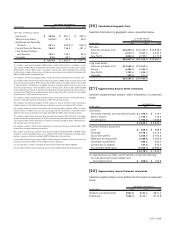
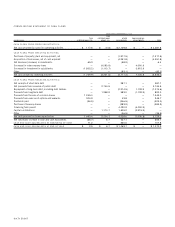
Selected information by industry segment is presented below.
AS AT AND FOR THE
YEAR ENDED SEPTEMBER 3 0 ,
(I N MILLI ONS) 2 0 0 0 1 9 9 9 1 9 9 8
NET SALES:
Electronics $ 9 , 9 0 9 .8 $ 6,087.4 $ 5,787.3
Telecommunications 2 ,5 3 9 .7 1,623.8 1,280.0
Healthcare and Specialty
Products 6 ,4 6 7 .9 5,742.7 4,672.4
Fire and Security Services 6 ,0 7 6 .6 5,534.0 4,393.5
Flow Control Products
and Services 3 ,9 3 7 .9 3,508.6 2,928.5
$ 2 8 ,9 3 1 .9 $22,496.5 $19,061.7
OPERATING INCOME (LOSS):
Electronics $ 2 , 5 3 8 .6 (1) $ (225.9)(6 ) $ 403.1(9 )
Telecommunications 5 1 6 .6 (2) 325.1 268.3
Healthcare and Specialty
Products 1 ,4 3 9 .8 (3 ) 890.9(7 ) 389.3(1 0)
Fire and Security Services 1 ,0 4 0 . 5 (4) 934.2(8 ) 630.6
Flow Control Products
and Services 7 4 6 .9 605.5 456.9
6 ,2 8 2 .4 2,529.8 2,148.2
Less: Corporate expenses (4 6 3 .6 )(5) (122.9) (68.3)
Goodwill amortization
expense (3 4 4 .4 ) (216.1) (131.8)
$ 5 , 4 7 4 .4 $ 2,190.8 $ 1,948.1
TOTAL ASSETS:
Electronics $ 1 2 ,2 4 8 .1 $ 8,326.9 $ 4,995.1
Telecommunications 2 ,0 2 9 .9 2,392.2 1,366.8
Healthcare and Specialty
Products 8 ,9 2 5 .6 8,696.2 7,256.8
Fire and Security Services 9 ,2 9 8 . 5 8,219.4 6,606.2
Flow Control Products
and Services 5 ,7 4 8 .4 3,858.6 2,960.3
Corporate 2 ,1 5 3 .8 851.0 255.5
$ 4 0 ,4 0 4 .3 $32,344.3 $23,440.7
DEPRECIATION AND
AMORTIZATION:
Electronics $ 5 6 3 .0 $ 421.3 $ 430.0
Telecommunications 6 7 .4 47.1 36.5
Healthcare and Specialty
Products 3 3 0 .1 287.6 262.5
Fire and Security Services 5 3 1 .6 417.2 269.8
Flow Control Products
and Services 1 4 4 .7 130.0 120.0
Corporate 7 .6 8.0 18.9
$ 1 , 6 4 4 .4 $ 1,311.2 $ 1,137.7