ADT 2000 Annual Report Download - page 27
Download and view the complete annual report
Please find page 27 of the 2000 ADT annual report below. You can navigate through the pages in the report by either clicking on the pages listed below, or by using the keyword search tool below to find specific information within the annual report.-
 1
1 -
2
-
3
-
4
-
5
-
6
-
7
-
8
-
9
-
10
-
11
-
12
-
13
-
14
-
15
-
16
-
 17
17 -
 18
18 -
 19
19 -
 20
20 -
 21
21 -
 22
22 -
 23
23 -
 24
24 -
 25
25 -
 26
26 -
 27
27 -
 28
28 -
 29
29 -
 30
30 -
 31
31 -
 32
32 -
 33
33 -
 34
34 -
 35
35 -
 36
36 -
 37
37 -
38
-
39
-
40
-
41
-
42
-
43
-
44
-
45
-
46
-
47
-
48
-
49
-
50
-
51
-
52
-
53
-
54
-
55
-
56
-
57
-
58
-
59
-
60
-
61
-
62
-
63
-
64
-
65
-
66
-
67
-
68
-
69
-
70
-
71
-
72
-
73
-
74
-
75
-
76
 |
 |

TWENTY FIVE
Management’s Discussion and Analysis of Financial Condition and Results of Operations
Results of Operations
Information for all periods presented below reflects the grouping of
Tyco’s businesses into five business segments consisting of Elec-
tronics, Telecommunications, Healthcare and Specialty Products,
Fire and Security Services, and Flow Control Products and Services.
In Fiscal 1999, we consummated two mergers that were
accounted for under the pooling of interests method of accounting.
The merger with United States Surgical Corporation closed on Octo-
ber 1, 1998, and the merger with AMP Incorporated closed on April
2, 1999. As required by generally accepted accounting principles in
the United States (“GAAP”), we restated our financial statements
as if USSC and AMP had always been a part of Tyco. We recorded as
expenses during Fiscal 1999 costs directly associated with the
USSC and AMP mergers and the costs of terminating employees and
closing or consolidating facilities as a result of the mergers. We also
expensed in Fiscal 1999 the costs of staff reductions and facility
closings that AMP undertook as part of a plan to improve its prof-
itability unrelated to our merger with AMP. In Fiscal 1998, we
expensed charges for staff reductions and facility closings under the
AMP profit improvement plan and charges that USSC incurred to
exit certain of its businesses. These are discussed in more detail
under “Liquidity and Capital Resources” below.
OVERVIEW
Sales increased 28.6% during Fiscal 2000 to $28,931.9 million
from $22,496.5 million in Fiscal 1999. Sales in Fiscal 1999
increased 18.0% compared to Fiscal 1998. Income before extraor-
dinary items was $4,520.1 million in Fiscal 2000, as compared to
$1,067.7 million in Fiscal 1999 and $1,168.6 million in Fiscal 1998.
Income before extraordinary items for Fiscal 2000 included an
after-tax net credit of $793.7 million ($1,484.7 million pre-tax) con-
sisting of restructuring, non-recurring and impairment charges of
$327.3 million ($424.2 million pre-tax) primarily for non-recurring
claims related to a merged company and the exiting of USSC’s
interventional cardiology business, offset by a credit of $113.6 mil-
lion ($148.9 million pre-tax) representing a revision of estimates of
merger, restructuring and other non-recurring accruals and a gain of
$1,007.4 million ($1,760.0 million pre-tax) on the issuance of com-
mon shares in connection with TyCom’s initial public offering.
Income before extraordinary items for Fiscal 1999 included an after-
tax net charge of $1,304.8 million ($1,542.7 million pre-tax) pri-
marily related to the mergers with USSC and AMP and costs
associated with AMP’s profit improvement plan. Income before
extraordinary items for Fiscal 1998 included an after-tax charge of
$192.0 million ($256.9 million pre-tax) primarily related to AMP’s
profit improvement plan and costs incurred by USSC to exit certain
businesses.
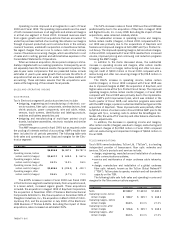
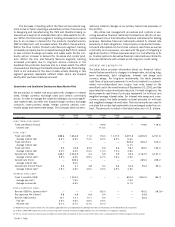
The following table details Tyco’s sales and earnings in Fiscal
2000, Fiscal 1999 and Fiscal 1998:
(I N MILLI ONS) FISCAL 20 00 FISCAL 19 99 FISCAL 19 98
Net sales $ 2 8 ,9 3 1 .9 $22,496.5 $19,061.7
Operating income, before
certain charges(1) $ 6 , 0 9 4 .1 (2) $ 3,949.6(2 ) $ 2,336.8
Merger, restructuring and other
non-recurring charges, net (1 7 6 .3 ) (1,035.2) (256.9)
Impairment of long-lived assets (9 9 .0 ) (507.5)
—
Amortization of goodwill (3 4 4 .4 ) (216.1) (131.8)
Operating income 5 ,4 7 4 .4 2,190.8 1,948.1
Interest expense, net (7 6 9 .6 ) (485.6) (245.3)
Gain on issuance of common
shares by subsidiary 1 ,7 6 0 .0
——
Income before income taxes,
minority interest and
extraordinary items 6 ,4 6 4 .8 1,705.2 1,702.8
Income taxes (1 ,9 2 6 .0 ) (637.5) (534.2)
Minority interest (1 8 .7 )
——
Income before extraordinary
items 4 ,5 2 0 .1 1,067.7 1,168.6
Extraordinary items,
net of taxes (0 .2 ) (45.7) (2.4)
Net income $ 4 ,5 1 9 .9 $ 1,022.0 $ 1,166.2
(1) This amount is the sum of the operating income of Tyco’s five business segments set forth in
the segment discussion below, less certain corporate expenses, and is before merger, restructuring
and other non-recurring charges, impairment of long-lived assets and amortization of goodwill.
(2) Net restructuring charges in the amount of $1.0 million and $106.4 million related to the write-
down of inventory have been deducted as part of cost of sales in the Consolidated Statements of
Operations for Fiscal 2000 and 1999, respectively. However, they have not been deducted as part
of cost of sales for the purpose of calculating operating income before certain charges in this table.
These charges are instead included in merger, restructuring and other non-recurring charges.
During Fiscal 2000 and 1999, we took merger, restructuring
and other non-recurring charges and charges for the impairment of
long-lived assets with respect to AMP and USSC. Under our restruc-
turing and integration programs, we terminate employees and close
facilities made redundant. The reduction in manpower and facilities
comes from the manufacturing, distribution, sales and administra-
tive functions. In addition, we discontinue or dispose of product
lines which do not fit the long-term strategy of the respective busi-
nesses. We do not separately track the impact on financial results of
the restructuring and integration programs. However, we estimate
that our overall cost structure has been reduced by approximately
$1,000.0 million on an annualized basis due to the impact associated
with these charges. The significant decreases have been to selling,
general and administrative expenses and to cost of sales.
Operating income and margins for our five business segments,
which are presented in accordance with GAAP in the following dis-
cussion, are supplemented by a discussion of operating income and
margins stated before deductions for merger, restructuring and other
non-recurring charges related to business combinations accounted
for under the pooling of interests method of accounting and charges
for impairment of long-lived assets. This supplemental discussion
of operating results before certain charges should not be considered
an alternative to operating or net income as an indicator of the per-
formance of our business, or as an alternative to cash flows from
operating activities as a measure of liquidity, in each case deter-
mined in accordance with GAAP.