ADT 2000 Annual Report Download - page 39
Download and view the complete annual report
Please find page 39 of the 2000 ADT annual report below. You can navigate through the pages in the report by either clicking on the pages listed below, or by using the keyword search tool below to find specific information within the annual report.-
 1
1 -
2
-
3
-
4
-
5
-
6
-
7
-
8
-
9
-
10
-
11
-
12
-
13
-
14
-
15
-
16
-
17
-
18
-
19
-
20
-
21
-
22
-
23
-
24
-
25
-
26
-
27
-
28
-
 29
29 -
 30
30 -
 31
31 -
 32
32 -
 33
33 -
 34
34 -
 35
35 -
 36
36 -
 37
37 -
 38
38 -
 39
39 -
 40
40 -
 41
41 -
 42
42 -
 43
43 -
 44
44 -
 45
45 -
 46
46 -
 47
47 -
 48
48 -
 49
49 -
50
-
51
-
52
-
53
-
54
-
55
-
56
-
57
-
58
-
59
-
60
-
61
-
62
-
63
-
64
-
65
-
66
-
67
-
68
-
69
-
70
-
71
-
72
-
73
-
74
-
75
-
76
 |
 |

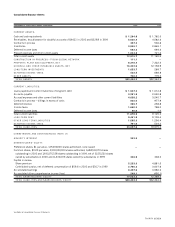
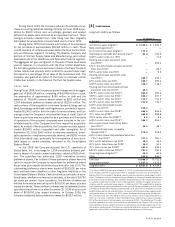
THIRTY SEVEN
SEPTEMBER 3 0 (IN MILLI ONS, EXCEPT SHARE DATA) 2 0 0 0 1 9 9 9
CURRENT ASSETS:
Cash and cash equivalents $ 1 ,2 6 4 .8 $ 1,762.0
Receivables, less allowance for doubtful accounts of $442.1 in 2000 and $329.8 in 1999 5,630.4 4,582.3
Contracts in process 357.3 536.6
Inventories 3,845.1 2,849.1
Deferred income taxes 683.3 694.3
Prepaid expenses and other current assets 1,034.8 721.2
Total current assets 12,815.7 11,145.5
CONSTRUCTION IN PROGRESS—TYCOM GLOBAL NETWORK 111.1
—
PROPERTY, PLANT AND EQUIPMENT, NET 8,218.4 7,322.4
GOODWILL AND OTHER INTANGIBLE ASSETS, NET 16,332.6 12,158.9
LONG-TERM INVESTMENTS 1,653.7 269.7
DEFERRED INCOME TAXES 532.5 668.8
OTHER ASSETS 740.3 779.0
TOTAL ASSETS $40,404.3 $32,344.3
CURRENT LIABILITIES:
Loans payable and current maturities of long-term debt $ 1 ,5 3 7 .2 $ 1,012.8
Accounts payable 3,291.9 2,530.8
Accrued expenses and other current liabilities 4,038.2 3,545.7
Contracts in process
—
billings in excess of costs 835.0 977.9
Deferred revenue 265.7 258.8
Income taxes 1,650.3 798.0
Deferred income taxes 6 0 .6 1.0
Total current liabilities 11,678.9 9,125.0
LONG-TERM DEBT 9,461.8 9,109.4
OTHER LONG-TERM LIABILITIES 1,095.3 1,236.4
DEFERRED INCOME TAXES 791.6 504.2
TOTAL LIABILITIES 23,027.6 19,975.0
COMMITMENTS AND CONTINGENCIES (NOTE 17)
MINORITY INTEREST 343.5
—
SHAREHOLDERS’ EQUITY:
Preference shares, $1 par value, 125,000,000 shares authorized, none issued
——
Common shares, $0.20 par value, 2,500,000,000 shares authorized; 1,684,511,070 shares
outstanding in 2000 and 1,690,175,338 shares outstanding in 1999, net of 31,551,310 shares
owned by subsidiaries in 2000 and 11,432,678 shares owned by subsidiaries in 1999 336.9 338.0
Capital in excess:
Share premium 5,233.3 4,881.5
Contributed surplus, net of deferred compensation of $59.4 in 2000 and $30.7 in 1999 2,786.3 3,607.6
Accumulated earnings 8,427.6 3,992.3
Accumulated other comprehensive income (loss) 249.1 (450.1)
TOTAL SHAREHOLDERS’ EQUITY 17,033.2 12,369.3
TOTAL LIABILITIES AND SHAREHOLDERS’ EQUITY $40,404.3 $32,344.3
See Notes to Consolidated Financial Statements.
Consolidated Balance Sheets