ADT 2000 Annual Report Download - page 31
Download and view the complete annual report
Please find page 31 of the 2000 ADT annual report below. You can navigate through the pages in the report by either clicking on the pages listed below, or by using the keyword search tool below to find specific information within the annual report.-
 1
1 -
2
-
3
-
4
-
5
-
6
-
7
-
8
-
9
-
10
-
11
-
12
-
13
-
14
-
15
-
16
-
17
-
18
-
19
-
20
-
 21
21 -
 22
22 -
 23
23 -
 24
24 -
 25
25 -
 26
26 -
 27
27 -
 28
28 -
 29
29 -
 30
30 -
 31
31 -
 32
32 -
 33
33 -
 34
34 -
 35
35 -
 36
36 -
 37
37 -
 38
38 -
 39
39 -
 40
40 -
 41
41 -
42
-
43
-
44
-
45
-
46
-
47
-
48
-
49
-
50
-
51
-
52
-
53
-
54
-
55
-
56
-
57
-
58
-
59
-
60
-
61
-
62
-
63
-
64
-
65
-
66
-
67
-
68
-
69
-
70
-
71
-
72
-
73
-
74
-
75
-
76
 |
 |

TWENTY NINE
American and European valve operations and at Earth Tech. Also,
royalty and licensing fee income from certain intellectual property
associated with the divested businesses offset a portion of the oper-
ating income lost from the divestitures. Increased operating margins
in Fiscal 2000 resulted primarily from royalty and licensing fee
income and margin improvement in the North American and Euro-
pean valve operations and at Earth Tech.
The 32.5% increase in operating income in Fiscal 1999 over
Fiscal 1998 was primarily due to increased sales in the European
flow control operations and North American valve products and at
Earth Tech. The increase in operating margins was principally due
to cost containment programs that improved margins in our North
American pipe products business and the worldwide valve opera-
tions. The gain on the sale of Mueller and portions of Grinnell in this
segment did not significantly impact operating profits and margins
in Fiscal 1999.
FOREIGN CURRENCY
The effect of changes in foreign exchange rates during Fiscal 2000,
Fiscal 1999 and Fiscal 1998 was not material to our sales and oper-
ating income.
CORPORATE EXPENSES
Corporate expenses, excluding non-recurring charges of $275.0 mil-
lion as a reserve for certain claims relating to a merged company in
the Healthcare business and other non-recurring charges of $1.2
million, were $187.4 million in Fiscal 2000 compared to $122.9 mil-
lion in Fiscal 1999 and $68.3 million in Fiscal 1998. These
increases were due principally to higher compensation expense
under our equity-based incentive compensation plans and an
increase in corporate staffing and related costs to support and mon-
itor our expanding businesses and operations.
AMORTIZATION OF GOODWILL
Amortization of goodwill, a non-cash charge, increased $128.3 mil-
lion to $344.4 million in Fiscal 2000 compared with Fiscal 1999.
Fiscal 1999 amortization of goodwill increased to $216.1 million
from $131.8 million in Fiscal 1998. The increase in amortization of
goodwill is due to the $5,162.0 million in consideration paid for
acquisitions and acquisition related costs in Fiscal 2000, which
resulted in goodwill and other intangibles of $5,206.8 million, and
the $6,923.3 million in consideration paid for acquisitions and
acquisition related costs in Fiscal 1999, which resulted in goodwill
and other intangibles of $5,807.9 million.
INTEREST EXPENSE, NET
Interest expense, net, increased $284.0 million to $769.6 million
in Fiscal 2000, as compared to Fiscal 1999, and increased $240.3
million to $485.6 million in Fiscal 1999, as compared to Fiscal
1998. These increases were primarily due to higher average debt
balances, resulting from borrowings to finance acquisitions and our
stock repurchase program and, to a lesser extent, higher average
interest rates in Fiscal 2000. The increase in borrowings was miti-
gated in part by the use of free cash flow to pay for certain acquisi-
tions. The weighted-average rate of interest on all long-term debt
during Fiscal 2000, Fiscal 1999 and Fiscal 1998 was 6.5%, 6.2%
and 6.4%, respectively.
EXTRAORDINARY ITEMS
Extraordinary items in Fiscal 2000, Fiscal 1999 and Fiscal 1998
included after-tax losses amounting to $0.2 million, $45.7 million
and $2.4 million, respectively, relating primarily to our tender offers
for debt and the write-off of net unamortized deferred financing
costs related to the LYONs. Further details are provided in Notes 4
and 13 to the Consolidated Financial Statements.
INCOME TAX EXPENSE
The effective income tax rate, excluding the impact of merger,
restructuring and other non-recurring credits (charges), charges for
the impairment of long-lived assets and gain on the sale of TyCom
shares, was 24.8% during Fiscal 2000 as compared to 27.0% in Fis-
cal 1999 and 30.6% in Fiscal 1998. The decreases in the effective
income tax rates were primarily due to higher earnings in tax juris-
dictions with lower income tax rates. We believe that we will gen-
erate sufficient future income to realize the tax benefits related to
our deferred tax assets. A valuation allowance has been maintained
due to continued uncertainties of realization of certain tax benefits,
primarily tax loss carryforwards (See Note 7).
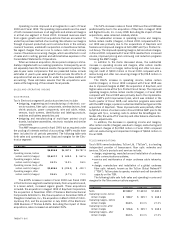
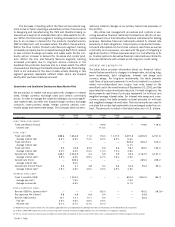
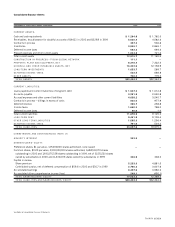
Liquidity and Capital Resources
The following table shows the sources of our cash flow from operat-
ing activities and the use of a portion of that cash in our operations
in Fiscal 2000 and Fiscal 1999. We refer to the net amount of cash
generated from operating activities less capital expenditures and
dividends as “free cash flow.”
(I N MILLI ONS) Fiscal 20 00 Fiscal 19 99
Operating income, before certain charges(1) $ 6 , 0 9 4 .1 $ 3,949.6
Depreciation and amortization(2) 1 ,3 0 0 . 0 1,095.1
Net increase in deferred income taxes 5 0 7 .8 351.6
Less:
Net increase in working capital(3) (6 4 .9 ) (122.6)
Interest expense, net (7 6 9 .6 ) (485.6)
Income tax expense (1 ,9 2 6 .0 ) (637.5)
Restructuring expenditures(4) (1 5 5 .2 ) (633.6)
Other, net 2 8 8 .8 32.8
Cash flow from operating activities 5 ,2 7 5 .0 3,549.8
Less:
Capital expenditures (1 ,8 1 4 .9 ) (1,632.5)
Dividends paid (8 6 .2 ) (187.9)
Free cash flow $ 3 ,3 7 3 .9 $ 1,729.4
(1) This amount is the sum of the operating income of the five business segments as set forth above,
less certain corporate expenses, and is before merger, restructuring and other non-recurring cred-
its and charges, charges for the impairment of long-lived assets and goodwill amortization.
(2) This amount is the sum of depreciation of tangible property ($1,095.0 million and $979.6 mil-
lion in Fiscal 2000 and Fiscal 1999, respectively) and amortization of intangible property other
than goodwill ($205.0 million and $115.5 million in Fiscal 2000 and Fiscal 1999, respectively).
(3) This amount is net of $100.0 million and $50.0 million received on the sale of accounts receiv-
able in Fiscal 2000 and Fiscal 1999, respectively.
(4) This amount is the sum of all cash paid out for (a) merger, restructuring and other non-
recurring charges in connection with business combinations accounted for on a pooling of interests
basis and (b) other restructuring and non-recurring charges taken by the pooled companies prior to
their combination with Tyco.