ADT 2000 Annual Report Download - page 28
Download and view the complete annual report
Please find page 28 of the 2000 ADT annual report below. You can navigate through the pages in the report by either clicking on the pages listed below, or by using the keyword search tool below to find specific information within the annual report.-
 1
1 -
2
-
3
-
4
-
5
-
6
-
7
-
8
-
9
-
10
-
11
-
12
-
13
-
14
-
15
-
16
-
17
-
 18
18 -
 19
19 -
 20
20 -
 21
21 -
 22
22 -
 23
23 -
 24
24 -
 25
25 -
 26
26 -
 27
27 -
 28
28 -
 29
29 -
 30
30 -
 31
31 -
 32
32 -
 33
33 -
 34
34 -
 35
35 -
 36
36 -
 37
37 -
 38
38 -
39
-
40
-
41
-
42
-
43
-
44
-
45
-
46
-
47
-
48
-
49
-
50
-
51
-
52
-
53
-
54
-
55
-
56
-
57
-
58
-
59
-
60
-
61
-
62
-
63
-
64
-
65
-
66
-
67
-
68
-
69
-
70
-
71
-
72
-
73
-
74
-
75
-
76
 |
 |

TWENTY SIX
Operating income improved in all segments in each of Fiscal
2000 and Fiscal 1999. The operating improvements are the result
of both increased revenues in all segments and enhanced margins
in all but one segment in Fiscal 2000. Increased revenues result
from organic growth and from acquisitions that are accounted for
under the purchase method of accounting. We enhance our margins
through improved productivity and cost reductions in the ordinary
course of business, unrelated to acquisition or divestiture activities.
We regard charges that we incur to reduce costs in the ordinary
course of business as recurring charges, which are reflected in cost
of sales and in selling, general and administrative expenses in the
Consolidated Statements of Operations.
When we make an acquisition, the acquired company is imme-
diately integrated with our existing operations. Consequently, we do
not separately track the financial results of acquired companies. The
year-to-year sales comparisons that are presented below include
estimates of year-to-year sales growth that exclude the effects of
acquisitions that are accounted for under the purchase method of
accounting. These estimates assume that the acquisitions were
made at the beginning of the relevant fiscal periods.
SALES AND OPERATING INCOME
ELECTRONICS
Tyco’s Electronics segment’s products and services include:
• designing, engineering and manufacturing of electronic con-
nector systems, fiber optic components, wireless devices, heat
shrink products, power components, wire and cable, relays,
sensors, touch screens, identification and labeling products,
switches and battery assemblies; and
• designing and manufacturing of multi-layer printed circuit
boards, backplane assemblies, electronic modules and similar
components.
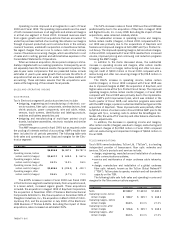
The AMP merger occurred in April 1999, but as required under
the pooling of interests method of accounting, AMP’s results have
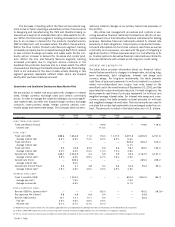
been included for all periods presented. The following table sets
forth sales and operating income (loss) and margins for the Elec-
tronics segment:
($ IN M I LLIONS) FISCAL 20 00 FISCAL 19 99 FISCAL 19 98
Sales $ 9 ,9 0 9 .8 $6,087.4 $5,787.3
Operating income, before
certain credits (charges) $ 2 ,4 4 7 .7 $ 848 .9 $ 567.6
Operating margins, before
certain credits (charges) 2 4 .7 % 13.9% 9.8%
Operating income (loss), after
certain credits (charges) $ 2 ,5 3 8 .6 $ (225.9) $ 403.1
Operating margins, after
certain credits (charges) 2 5 .6 % (3.7%) 7.0%
The 62.8% increase in sales in Fiscal 2000 over Fiscal 1999
in the Electronics segment resulted primarily from acquisitions and,
to a lesser extent, increased organic growth. These acquisitions
included: the acquisition in August 1999 of Raychem Corporation;
the acquisition in November 1999 of Siemens Electromechanical
Components GmbH & Co. KG; the acquisition in December 1999 of
Praegitzer Industries, Inc.; the acquisition in March 2000 of Critch-
ley Group PLC; and the acquisition in July 2000 of the Electronic
OEM Business of Thomas & Betts. Excluding the impact of these
acquisitions, sales increased an estimated 15.1%.
The 5.2% increase in sales in Fiscal 1999 over Fiscal 1998 was
predominantly due to the acquisition of Raychem in August 1999
and Sigma Circuits, Inc. in July 1998. Excluding the impact of these
acquisitions, sales remained relatively stable.
The substantial increase in operating income and margins,
before certain credits (charges), in Fiscal 2000 compared with Fis-
cal 1999 was primarily due to the acquisitions of Raychem and
Siemens and improved margins at both AMP and Tyco Printed Cir-
cuit Group. The improved operating margins, before certain charges,
in Fiscal 2000 compared with Fiscal 1999 resulted from increased
volume, improved pricing and continuing cost reduction programs
following the AMP merger.
In addition to the items discussed above, the substantial
increase in operating income and margins, after certain credits
(charges), was due to a merger, restructuring and other non-recur-
ring net credit of $90.9 million in Fiscal 2000 compared with a
restructuring and other non-recurring charge of $1,074.8 million in
Fiscal 1999.
The 49.6% increase in operating income, before certain
credits (charges), in Fiscal 1999 compared with Fiscal 1998 was
due to improved margins at AMP, the acquisition of Raychem, and
higher sales volume at the Tyco Printed Circuit Group. The improved
operating margins, before certain credits (charges), in Fiscal 1999
compared with Fiscal 1998 were primarily due to the implementa-
tion of AMP’s profit improvement plan, which was initiated in the
fourth quarter of Fiscal 1998, cost reduction programs associated
with the AMP merger, a pension curtailment/settlement gain and the
acquisition of Raychem. These improvements were partially offset
by $253.4 million of certain costs in Fiscal 1999 at AMP prior to the
merger with Tyco, including costs to defend the AlliedSignal Inc.
tender offer, the write-off of inventory and other balance sheet write-
offs and adjustments.
In addition, the decrease in operating income and margins,
after certain credits (charges), was due to merger, restructuring and
impairment charges of $1,074.8 million in Fiscal 1999 compared
with net restructuring and impairment charges of $164.4 million in
Fiscal 1998.
TELECOMMUNICATIONS
Tyco’s 86% owned subsidiary, TyCom Ltd. (“TyCom”), is a leading
independent provider of transoceanic fiber optic networks and
services. TyCom’s products and services include:
• design, engineering, manufacture and installation of undersea
cable communications systems;
• service and maintenance of major undersea cable networks;
and
• design, manufacture and installation of a global undersea
fiber optic network, known as the TyCom Global NetworkTM
(“TGN”). TyCom plans to operate, maintain and sell bandwidth
capacity on the TGN.
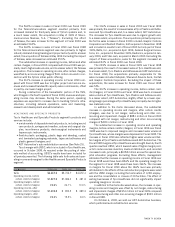
The following table sets forth sales and operating income and
margins for the Telecommunications segment:
($ IN M I LLIONS) FISCAL 20 00 FISCAL 19 99 FISCAL 19 98
Sales $ 2 ,5 3 9 .7 $1,623.8 $1,280.0
Operating income, before
certain charges $ 5 2 9 . 7 $ 325.1 $ 268.3
Operating margins, before
certain charges 2 0 .9 % 20.0% 21.0%
Operating income, after
certain charges $ 5 1 6 . 6 $ 325.1 $ 268.3
Operating margins, after
certain charges 2 0 .3 % 20.0% 21.0%