ADT 2000 Annual Report Download - page 56
Download and view the complete annual report
Please find page 56 of the 2000 ADT annual report below. You can navigate through the pages in the report by either clicking on the pages listed below, or by using the keyword search tool below to find specific information within the annual report.-
 1
1 -
2
-
3
-
4
-
5
-
6
-
7
-
8
-
9
-
10
-
11
-
12
-
13
-
14
-
15
-
16
-
17
-
18
-
19
-
20
-
21
-
22
-
23
-
24
-
25
-
26
-
27
-
28
-
29
-
30
-
31
-
32
-
33
-
34
-
35
-
36
-
37
-
38
-
39
-
40
-
41
-
42
-
43
-
44
-
45
-
 46
46 -
 47
47 -
 48
48 -
 49
49 -
 50
50 -
 51
51 -
 52
52 -
 53
53 -
 54
54 -
 55
55 -
 56
56 -
 57
57 -
 58
58 -
 59
59 -
 60
60 -
 61
61 -
 62
62 -
 63
63 -
 64
64 -
 65
65 -
 66
66 -
67
-
68
-
69
-
70
-
71
-
72
-
73
-
74
-
75
-
76
 |
 |

FIFTY FOUR
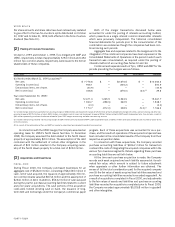
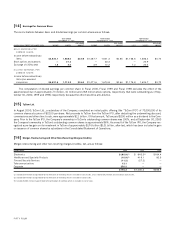
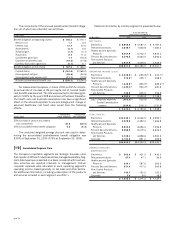
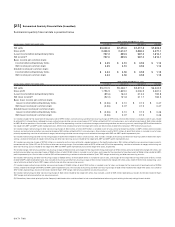
[1 4 ] Earnings Per Common Share
The reconciliations between basic and diluted earnings per common share are as follows:
YEAR ENDED YEAR EN DED YEAR ENDED
SEPTEMBER 3 0 , 2 0 00 SEPTEM BER 30 , 1 99 9 SEPTEMBER 3 0 , 1 9 98
PER SHARE PER SHARE PER SH ARE
(I N MILLI ONS, EXCEPT PER SHARE DATA) INCOME SHARES AMOUNT INCOME SHARES AMOUNT LOSS SHARES AMOUNT
BASIC EARNINGS PER
COMMON SHARE:
Income before extraordinary
items $ 4 ,5 2 0 .1 1 , 6 8 8 .0 $ 2 .6 8 $1,067.7 1,641.3 $0.65 $1,168.6 1,583.4 $0.74
Stock options and warrants
—
2 1 .2
—
23.3
—
20.9
Exchange of LYONs debt 1 .5 4 .0 3.9 10.2 7.2 20.4
DILUTED EARNINGS PER
COMMON SHARE:
Income before extraordinary
items plus assumed
conversions $ 4 ,5 2 1 .6 1 , 7 1 3 .2 $ 2 .6 4 $1,071.6 1,674.8 $0.64 $1,175.8 1,624.7 $0.72
The computation of diluted earnings per common share in Fiscal 2000, Fiscal 1999 and Fiscal 1998 excludes the effect of the
assumed exercise of approximately 7.3 million, 3.1 million and 23.8 million stock options, respectively, that were outstanding as of Sep-
tember 30, 2000, 1999 and 1998, respectively, because the effect would be anti-dilutive.
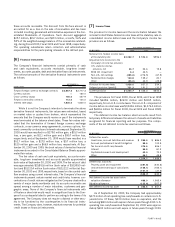
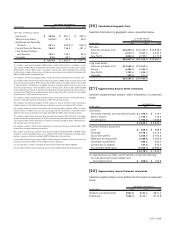
[1 5 ] TyCom Ltd.
In August 2000, TyCom Ltd., a subsidiary of the Company, completed an initial public offering (the “TyCom IPO”) of 70,300,000 of its
common shares at a price of $32.00 per share. Net proceeds to TyCom from the TyCom IPO, after deducting the underwriting discount,
commissions and other direct costs, were approximately $2.1 billion. Of that amount, TyCom paid $200 million as a dividend to the Com-
pany. Prior to the TyCom IPO, the Company’s ownership in TyCom’s outstanding common shares was 100%, and at September 30, 2000
the Company’s ownership in TyCom’s outstanding common shares is approximately 86%. As a result of the TyCom IPO, the Company rec-
ognized a pre-tax gain on its investment in TyCom of approximately $1.76 billion ($1.01 billion, after-tax), which has been included in gain
on issuance of common shares by subsidiary in the Consolidated Statement of Operations.
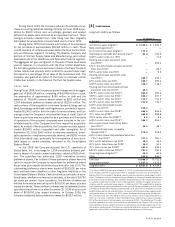
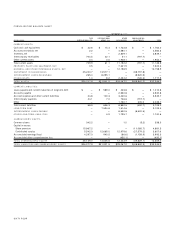
[1 6 ] Merger, Restructuring and Other Non-Recurring Charges (Credits)
Merger, restructuring and other non-recurring charges (credits), net, are as follows:
(I N MILLI ONS) 2 0 0 0 1 9 99 1 99 8
Electronics $ (9 0 .9 )(1 ) $ 643.3(3 ) $164.4
Healthcare and Specialty Products (1 0 .9 )(2) 419.1 92.5
Fire and Security Services (1 1 .2 ) (27.2)
—
Telecommunications 1 3 .1
——
Corporate 2 7 6 .2
——
$ 1 7 6 .3 $1,035.2 $256.9
(1) Includes $0.9 million charge related to the write-down of inventory, which is included in cost of sales, and a credit of $6.3 million also included in cost of sales.
(2) Includes $6.4 million charge related to the write-down of inventory, which is included in cost of sales.
(3) Includes $106.4 million charge related to the write-down of inventory, which is included in cost of sales.