ADT 2000 Annual Report Download - page 68
Download and view the complete annual report
Please find page 68 of the 2000 ADT annual report below. You can navigate through the pages in the report by either clicking on the pages listed below, or by using the keyword search tool below to find specific information within the annual report.-
 1
1 -
2
-
3
-
4
-
5
-
6
-
7
-
8
-
9
-
10
-
11
-
12
-
13
-
14
-
15
-
16
-
17
-
18
-
19
-
20
-
21
-
22
-
23
-
24
-
25
-
26
-
27
-
28
-
29
-
30
-
31
-
32
-
33
-
34
-
35
-
36
-
37
-
38
-
39
-
40
-
41
-
42
-
43
-
44
-
45
-
46
-
47
-
48
-
49
-
50
-
51
-
52
-
53
-
54
-
55
-
56
-
57
-
 58
58 -
 59
59 -
 60
60 -
 61
61 -
 62
62 -
 63
63 -
 64
64 -
 65
65 -
 66
66 -
 67
67 -
 68
68 -
 69
69 -
 70
70 -
 71
71 -
 72
72 -
 73
73 -
 74
74 -
 75
75 -
 76
76
 |
 |

SIXTY SIX
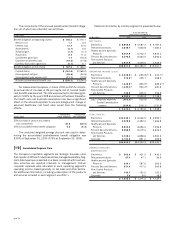
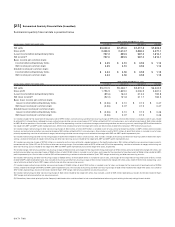
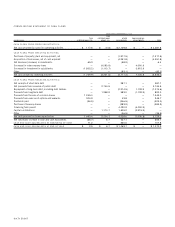
CONSOLIDATING STATEMENT OF OPERATIONS
YEAR ENDED SEPTEMBER 3 0 , 19 98
TYCO
TYCO INTERNATIONAL OTHER CONSOLIDATI N G
(I N MILLI ONS) INTERN ATIONAL LTD. GROUP, S.A. SU BSIDIARIES( 1 ) ADJUSTMENTS TOTAL
NET SALES $
—
$
—
$19,061.7 $
—
$19,061.7
Cost of sales
——
12,694.8
—
12,694.8
Selling, general and administrative expenses 18.2 58.9 4,084.8
—
4,161.9
Merger, restructuring and other non-recurring charges
——
256.9
—
256.9
OPERATING INCOME (LOSS) (18.2) (58.9) 2,025.2
—
1,948.1
Interest income (expense), net 4.0 (65.3) (184.0)
—
(245.3)
Equity in net income of unconsolidated subsidiaries 902.4 721.5
—
(1,623.9)
—
Intercompany dividends, interest and fees 613.8 98.5 (443.9) (268.4)
—
Income before income taxes and extraordinary items 1,502.0 695.8 1,397.3 (1,892.3) 1,702.8
Income taxes
——
(466.8) (67.4) (534.2)
Income before extraordinary items 1,502.0 695.8 930.5 (1,959.7) 1,168.6
Extraordinary items, net of taxes(2)
——
(2.4)
—
(2.4)
NET INCOME $1,502.0 $695.8 $ 928.1 $(1,959.7) $ 1,166.2
(1) Operating income includes restructuring and other non-recurring charges recorded by AMP of $185.8 million related to its profit improvement plan and a credit of $21.4 million to restructuring charges
representing a revision of estimates related to AMP’s 1996 restructuring activities. Also included are non-recurring charges of $80.5 million and restructuring charges of $12.0 million related to USSC’s
operations.
(2) Extraordinary items relate principally to the write-off of net unamortized deferred refinancing costs relating to the early extinguishment of debt.
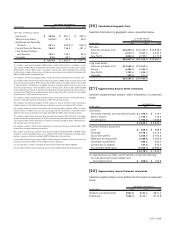
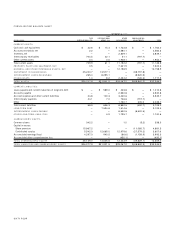
CONSOLIDATING STATEMENT OF CASH FLOWS
YEAR ENDED SEPTEMBER 3 0 , 20 00
TYCO
TYCO INTERNATIONAL OTHER CONSOLIDATI N G
(I N MILLI ONS) INTERN ATIONAL LTD. GROUP, S.A. SU BSIDIARIES ADJUSTMENTS TOTAL
CASH FLOWS FROM OPERATING ACTIVITIES:
Net cash provided by operating activities $ 8 9 3 .7 $ 1 ,2 0 1 .3 $ 3 , 1 8 0 .0 $
—
$ 5 ,2 7 5 .0
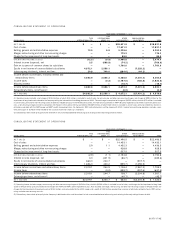
CASH FLOWS FROM INVESTING ACTIVITIES:
Purchase of property, plant and equipment, net (6 .4 )
—
(1 ,8 0 8 .5 )
—
(1 ,8 1 4 .9 )
Acquisition of businesses, net of cash acquired
——
(4 ,7 9 0 .7 )
—
(4 ,7 9 0 .7 )
Disposal of businesses
——
7 4 .4
—
7 4 .4
Net decrease (increase) in investments 1 6 .4
—
(3 6 9 .8 )
—
(3 5 3 .4 )
(Increase) in intercompany loans
—
(2,421.8)
—
2 ,4 2 1 .8
—
(Increase) in investment in subsidiaries (900.7)
——
9 0 0 .7
—
Other
—
(0 .7 ) (5 2 .2 )
—
(5 2 .9 )
Net cash utilized by investing activities (8 9 0 . 7 ) (2 ,4 2 2 .5 ) (6 ,9 4 6 . 8 ) 3 ,3 2 2 .5 (6 ,9 3 7 .5 )
CASH FLOWS FROM FINANCING ACTIVITIES:
Net (payments) of short-term debt
—
(5 8 7 .3 ) (1 4 8 .7 )
—
(7 3 6 .0 )
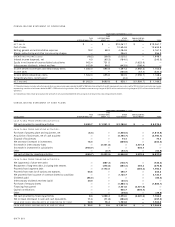
Repayment of long-term debt, including debt tenders
—
(3 7 6 .8 ) (3 8 0 .3 ) 3 8 0 .3 (3 7 6 .8 )
Proceeds from long-term debt
—
2,173.5
—
(3 8 0 .3 ) 1 ,7 9 3 .2
Proceeds from exercise of options and warrants 6 4 .6
—
2 9 0 .7
—
3 5 5 .3
Net proceeds from issuance of common shares by subsidiary
——
2 ,1 3 0 .7
—
2 ,1 3 0 .7
Dividends paid (8 6 .2 )
———
(8 6 .2 )
Intercompany dividends received (paid) 3 0 .0
—
(3 0 .0 )
——
Purchase of treasury shares
——
(1 ,8 8 5 .1 )
—
(1 ,8 8 5 .1 )
Financing from parent
——
2 ,4 2 1 .8 (2 ,4 2 1 .8 )
—
Capital contributions
——
9 0 0 .7 (9 0 0 .7 )
—
Other
——
(2 9 .8 )
—
(2 9 .8 )
Net cash provided by financing activities 8 .4 1 ,2 0 9 . 4 3 ,2 7 0 .0 (3 ,3 2 2 .5 ) 1 ,1 6 5 .3
Net increase (decrease) in cash and cash equivalents 1 1 .4 (1 1 .8 ) (4 9 6 .8 )
—
(4 9 7 .2 )
CASH AND CASH EQUIVALENTS AT BEGINNING OF YEAR 2 2 . 8 1 5 . 4 1 ,7 2 3 . 8
—
1 ,7 6 2 .0
CASH AND CASH EQUIVALENTS AT END OF YEAR $ 3 4 .2 $ 3 .6 $ 1 ,2 2 7 .0 $
—
$ 1 ,2 6 4 .8