ADT 2000 Annual Report Download - page 51
Download and view the complete annual report
Please find page 51 of the 2000 ADT annual report below. You can navigate through the pages in the report by either clicking on the pages listed below, or by using the keyword search tool below to find specific information within the annual report.-
 1
1 -
2
-
3
-
4
-
5
-
6
-
7
-
8
-
9
-
10
-
11
-
12
-
13
-
14
-
15
-
16
-
17
-
18
-
19
-
20
-
21
-
22
-
23
-
24
-
25
-
26
-
27
-
28
-
29
-
30
-
31
-
32
-
33
-
34
-
35
-
36
-
37
-
38
-
39
-
40
-
 41
41 -
 42
42 -
 43
43 -
 44
44 -
 45
45 -
 46
46 -
 47
47 -
 48
48 -
 49
49 -
 50
50 -
 51
51 -
 52
52 -
 53
53 -
 54
54 -
 55
55 -
 56
56 -
 57
57 -
 58
58 -
 59
59 -
 60
60 -
 61
61 -
62
-
63
-
64
-
65
-
66
-
67
-
68
-
69
-
70
-
71
-
72
-
73
-
74
-
75
-
76
 |
 |

FORTY NINE
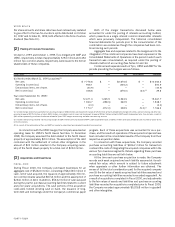
these accounts receivable. The discount from the face amount is
accounted for as a loss on the sale of receivables and has been
included in selling, general and administrative expenses in the Con-
solidated Statements of Operations. Such discount aggregated
$25.7 million, $15.7 million, and $17.3 million, or 6.6%, 5.6% and
5.8% of the weighted-average balance of the receivables outstand-
ing, during Fiscal 2000, Fiscal 1999 and Fiscal 1998, respectively.
The operating subsidiaries retain collection and administrative
responsibilities for the participating interests in the defined pool.
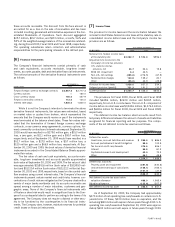
[6 ] Financial Instruments
The Company’s financial instruments consist primarily of cash
and cash equivalents, accounts receivable, long-term invest-
ments, accounts payable, debt and derivative financial instruments.
The notional amounts of the derivative financial instruments were
as follows:
SEPTEMBER 3 0 ,
(I N MILLI ONS) 2 0 0 0 1 9 9 9
Forward foreign currency exchange contracts $2,867.5 $2,717.3
Currency options
—
160.0
Cross-currency swaps 150.0 447.9
Forward commodity contracts 112.0 104.0
Interest rate swaps 1,800.0 1,800.0
While it is not the Company’s intention to terminate the above
derivative financial instruments, fair values were estimated, based
on market rates or quotes from brokers, which represented the
amounts that the Company would receive or pay if the instruments
were terminated at the balance sheet dates. These fair values indi-
cated that the termination of forward foreign currency exchange
contracts, cross-currency swap agreements, currency options, for-
ward commodity contracts and interest rate swaps at September 30,
2000 would have resulted in a $279.0 million gain, a $15.3 million
loss, a zero gain, an $11.1 million gain and a $95.7 million loss,
respectively, and at September 30, 1999 would have resulted in a
$52.7 million loss, a $27.0 million loss, a $0.7 million loss, a
$13.0 million gain and a $66.9 million loss, respectively. At Sep-
tember 30, 2000 and 1999, the book values of derivative financial
instruments recorded in the Consolidated Balance Sheets approxi-
mated fair values.
The fair value of cash and cash equivalents, accounts receiv-
able, long-term investments and accounts payable approximated
book value at September 30, 2000 and 1999. The fair value of debt
was approximately $10,851.6 million (book value of $10,999.0 mil-
lion) and $10,120.4 million (book value of $10,122.2 million) at Sep-
tember 30, 2000 and 1999, respectively, based on discounted cash
flow analyses using current interest rates. The Company’s financial
instruments present certain market and credit risks; however, con-
centrations of credit risk are mitigated as the Company deals with a
variety of major banks worldwide and its accounts receivable are
spread among a number of major industries, customers and geo-
graphic areas. None of the Company’s financial instruments with
off-balance sheet risk would result in a significant loss to the Com-
pany if a counterparty failed to perform according to the terms of its
agreement. The Company does not require collateral or other secu-
rity to be furnished by the counterparties to its financial instru-
ments. The Company does, however, maintain reserves for potential
credit losses on financial instruments.
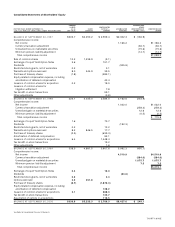
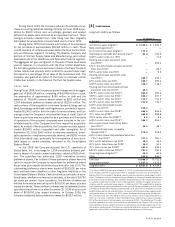
[7 ] Income Taxes
The provision for income taxes and the reconciliation between the
notional United States federal income taxes at the statutory rate on
consolidated income before taxes and the Company’s income tax
provision are as follows:
YEAR ENDED SEPTEMBER 3 0 ,
(I N MILLI ONS) 2 00 0 1 9 9 9 19 9 8
Notional U.S. federal income taxes
at the statutory rate $ 2 ,2 6 2 .7 $ 596.8 $596.0
Adjustments to reconcile to the
Company’s income tax provision:
U.S. state income tax
provision, net 4 6 .7 33.6 15.8
SFAS 121 impairment 6 .4 43.5
—
Non-U.S. net earnings (4 9 5 .6 ) (216.5) (67.9)
Nondeductible charges 1 4 0 .8 139.2 20.1
Other (3 5 .0 ) 40.9 (29.8)
Provision for income taxes 1 ,9 2 6 .0 637.5 534.2
Deferred provision (benefit) 7 2 1 .3 191.2 (10.0)
Current provision $ 1 ,2 0 4 .7 $ 446.3 $544.2
The provisions for Fiscal 2000, Fiscal 1999, and Fiscal 1998
included $648.6 million, $263.9 million and $210.5 million,
respectively, for non-U.S. income taxes. The non-U.S. component of
income before income taxes was $3,343.6 million, $1,376.3 million
and $640.6 million for Fiscal 2000, Fiscal 1999 and Fiscal 1998,
respectively.
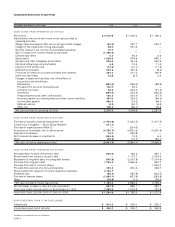
The deferred income tax balance sheet accounts result from
temporary differences between the amount of assets and liabilities
recognized for financial reporting and tax purposes. The compo-
nents of the net deferred income tax asset are as follows:
SEPTEMBER 3 0 ,
(I N MILLI ONS) 2 0 0 0 1 9 9 9
Deferred tax assets:
Inventories, accrued liabilities and reserves $ 2 9 5 .5 $ 886.3
Accrued postretirement benefit obligation 9 9 .6 102.9
Tax loss and credit carryforwards 4 7 4 .6 506.1
Interest 8 5 .9 81.2
Capitalized research and development 6 3 .0 72.3
Other 5 6 .1 49.8
1 ,0 7 4 .7 1,698.6
Deferred tax liabilities:
Property, plant and equipment (2 8 1 .9 ) (440.6)
Undistributed earnings of subsidiaries (1 5 5 .1 ) (155.1)
Other (1 5 1 .7 ) (37.5)
(5 8 8 .7 ) (633.2)
Net deferred income tax asset before
valuation allowance 4 8 6 .0 1,065.4
Valuation allowance (1 2 2 .4 ) (207.5)
Net deferred income tax asset $ 3 6 3 . 6 $ 857.9
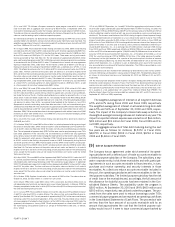
As of September 30, 2000, the Company had approximately
$370 million of net operating loss carryforwards in certain non-U.S.
jurisdictions. Of these, $230 million have no expiration, and the
remaining $140 million will expire in future years through 2010. U.S.
operating loss carryforwards at September 30, 2000 were approxi-
mately $692 million and will expire in future years through 2020.