ADT 2000 Annual Report Download - page 34
Download and view the complete annual report
Please find page 34 of the 2000 ADT annual report below. You can navigate through the pages in the report by either clicking on the pages listed below, or by using the keyword search tool below to find specific information within the annual report.-
 1
1 -
2
-
3
-
4
-
5
-
6
-
7
-
8
-
9
-
10
-
11
-
12
-
13
-
14
-
15
-
16
-
17
-
18
-
19
-
20
-
21
-
22
-
23
-
 24
24 -
 25
25 -
 26
26 -
 27
27 -
 28
28 -
 29
29 -
 30
30 -
 31
31 -
 32
32 -
 33
33 -
 34
34 -
 35
35 -
 36
36 -
 37
37 -
 38
38 -
 39
39 -
 40
40 -
 41
41 -
 42
42 -
 43
43 -
 44
44 -
45
-
46
-
47
-
48
-
49
-
50
-
51
-
52
-
53
-
54
-
55
-
56
-
57
-
58
-
59
-
60
-
61
-
62
-
63
-
64
-
65
-
66
-
67
-
68
-
69
-
70
-
71
-
72
-
73
-
74
-
75
-
76
 |
 |

THIRTY TWO
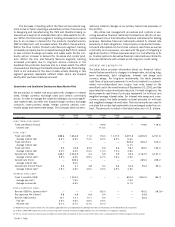
The decrease in backlog within the Telecommunications seg-
ment is due to TyCom devoting a substantial portion of its resources
to designing and manufacturing the TGN and therefore taking on
less work as a supplier of undersea fiber optic cable systems for oth-
ers. Within the Electronics segment, backlog increased principally
due to an increase in demand for the products manufactured by
AMP and Raychem, and to a lesser extent, the effect of acquisitions.
Within the Flow Control Products and Services segment, backlog
increased principally due to increased backlog at Earth Tech, related
to new contract bookings and water and waste water facility con-
tracts, and an increase in demand for its valves and control prod-
ucts. Within the Fire and Security Services segment, backlog
increased principally due to long-term service contracts in the
Australian fire protection business and, to a lesser extent, the effect
of acquisitions. Backlog in the Healthcare and Specialty Products seg-
ment is not indicative of the level of sales activity. Backlog in this
segment generally represents unfilled orders which are shipped
shortly after purchase orders are received.
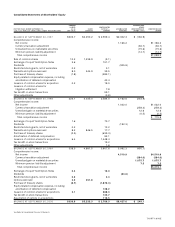
Quantitative and Qualitative Disclosures About Market Risk
We are subject to market risk associated with changes in interest
rates, foreign currency exchange rates and certain commodity
prices. In order to manage the volatility relating to our more signifi-
cant market risks, we enter into forward foreign currency exchange
contracts, cross-currency swaps, foreign currency options, com-
modity swaps and interest rate swaps. The Company does not antic-
ipate any material changes in our primary market risk exposures in
Fiscal 2001.
We utilize risk management procedures and controls in exe-
cuting derivative financial instrument transactions. We do not exe-
cute transactions or hold derivative financial instruments for trading
purposes. Derivative financial instruments related to interest rate
sensitivity of debt obligations, intercompany cross-border transac-
tions and anticipated non-functional currency cash flows, as well as
commodity price exposures, are used with the goal of mitigating a
significant portion of these exposures when it is cost effective to do
so. Counter-parties to derivative financial instruments are limited to
financial institutions with at least an AA long-term credit rating.
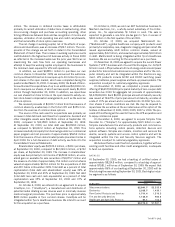
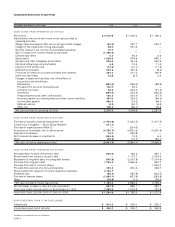
INTEREST RATE SENSITIVITY
The table below provides information about our financial instru-
ments that are sensitive to changes in interest rates, including long-
term investments, debt obligations, interest rate swaps and
currency swaps. For long-term investments, the table presents
cash flows of principal payments (in millions) related to a subordi-
nated, non-collateralized zero coupon loan note, based on the
amortized cost of the investment as of September 30, 2000, and the
associated fair value interest rate discount. For debt obligations, the
table presents cash flows of principal repayment (in millions) and
weighted-average interest rates. For interest rate swaps and cross-
currency swaps, the table presents notional amounts (in millions)
and weighted-average interest rates. Notional amounts are used to
calculate the contractual payments to be exchanged under the con-
tract. The amounts included in the table below are in U.S. dollars.
FISCAL FISCAL FISCAL FISCAL FISCAL FAI R
($ IN M I LLIONS) 2 0 0 1 2 0 0 2 2 0 0 3 2 0 0 4 2 0 0 5 THEREAFTER TOTAL VALUE
LONG-TERM INVESTMENT:
Fixed rate (British Pound)
———
119.6
——
119.6 119.6
Interest rate 11.5%
TOTAL DEBT:
Fixed rate (US$) 858.6 1,354.8 11.2 113.0 1,147.5 3,391.8 6,876.9 6,721.8
Average interest rate 6.3% 6.9% 7.4% 6.2% 6.2% 6.6%
Fixed rate (Euro)
—————
525.4 525.4 515.0
Average interest rate 6.1%
Fixed rate (Yen) 9.0 22.8 33.5 5.6 5.6 58.7 135.2 153.3
Average interest rate 3.2% 3.4% 2.2% 1.4% 1.4% 4.8%
Variable rate (US$) 666.1 2,454.5 4.4 5.8 2.9 33.3 3,167.0 3,167.0
Average interest rate(1) 5.9% 6.9% 5.9% 6.7% 7.6% 4.9%
Variable rate (Euro)
—
239.2
————
239.2 239.2
Average interest rate 5.0%
Variable rate (French Franc) 3.5 4.1 4.8 5.0 5.6 32.3 55.3 55.3
Average interest rate(1) 4.9% 4.9% 4.9% 4.9% 4.9% 4.9%
INTEREST RATE SWAP:
Fixed to variable (US$)
—
1,000.0
———
800.0 1,800.0 (95.7)
Average pay rate(1) 7.9% 7.3%
Average receive rate 6.9% 6.1%
CROSS-CURRENCY SWAP:
Receive US$/Pay Japanese Yen(2)
———
150.0
——
150.0 (18.3)(3)
Pay Japanese Yen interest 6.8 6.8 6.8 3.4
——
23.8
Receive US$ interest 10.1 10.1 10.1 5.0
——
35.3
Pay rate 4.6% 4.6% 4.6% 4.6%
Receive rate 6.7% 6.7% 6.7% 6.7%
(1) Weighted-average variable interest rates are based on applicable rates as of September 30, 200 0 per the terms of the contracts of the related financial instruments.
(2) In March 1994, AMP entered into a cross-currency swap with a financial institution to hedge a portion of its net investment in its Japanese subsidiary.
(3) The fair value of the cross-currency swap included in the table reflects the portion of the fair value of the contract that is attributable to the interest component of the contract.