ADT 2000 Annual Report Download - page 65
Download and view the complete annual report
Please find page 65 of the 2000 ADT annual report below. You can navigate through the pages in the report by either clicking on the pages listed below, or by using the keyword search tool below to find specific information within the annual report.-
 1
1 -
2
-
3
-
4
-
5
-
6
-
7
-
8
-
9
-
10
-
11
-
12
-
13
-
14
-
15
-
16
-
17
-
18
-
19
-
20
-
21
-
22
-
23
-
24
-
25
-
26
-
27
-
28
-
29
-
30
-
31
-
32
-
33
-
34
-
35
-
36
-
37
-
38
-
39
-
40
-
41
-
42
-
43
-
44
-
45
-
46
-
47
-
48
-
49
-
50
-
51
-
52
-
53
-
54
-
 55
55 -
 56
56 -
 57
57 -
 58
58 -
 59
59 -
 60
60 -
 61
61 -
 62
62 -
 63
63 -
 64
64 -
 65
65 -
 66
66 -
 67
67 -
 68
68 -
 69
69 -
 70
70 -
 71
71 -
 72
72 -
 73
73 -
 74
74 -
 75
75 -
76
 |
 |
SIXTY THREE
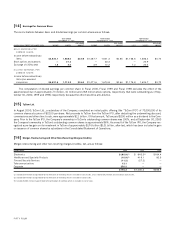
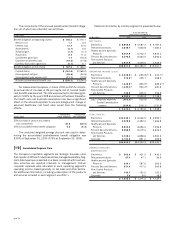
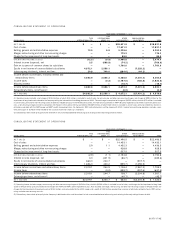
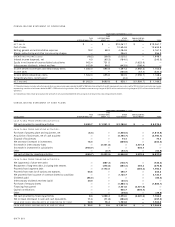
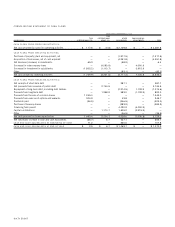
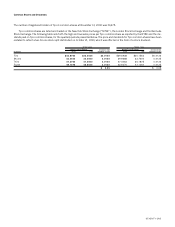
[2 4 ] Tyco International Group S.A.
During Fiscal 2000 and Fiscal 1999, Tyco International Group S.A. (“TIG”), a wholly-owned subsidiary of the Company, issued public debt
securities (See Note 4) which are fully and unconditionally guaranteed by Tyco. In accordance with SEC rules promulgated in August 2000,
the following presents condensed consolidating financial information for TIG and its subsidiaries, as if TIG and its current organizational
structure were in place for all periods presented. Condensed financial information for Tyco and TIG on a stand-alone basis are presented
using the equity method of accounting for subsidiaries in which it owns or controls twenty percent or more of the voting shares.
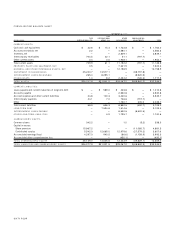
CONSOLIDATING BALANCE SHEET
SEPTEMBER 3 0 , 2 0 00
TYCO
TYCO INTERNATIONAL OTHER CONSOLIDATI N G
(I N MILLI ONS) INTERN ATIONAL LTD. GROUP, S.A. SU BSIDIARIES ADJUSTMENTS TOTAL
CURRENT ASSETS:
Cash and cash equivalents $ 3 4 .2 $ 3 .6 $ 1 ,2 2 7 . 0 $
—
$ 1 , 2 6 4 .8
Accounts receivable, net 1 .2
—
5 ,6 2 9 .2
—
5 ,6 3 0 .4
Inventory, net
——
3 ,8 4 5 .1
—
3 ,8 4 5 .1
Intercompany receivables 8 0 2 .4 5 1 .3 3 , 6 6 1 .3 (4 ,5 1 5 .0 )
—
Other current assets
—
1 4 .4 2 ,0 6 1 . 0
—
2 ,0 7 5 .4
Total current assets 8 3 7 . 8 6 9 .3 1 6 ,4 2 3 .6 (4 ,5 1 5 .0 ) 1 2 , 8 1 5 .7
PROPERTY, PLANT AND EQUIPMENT, NET 6 .7
—
8 ,3 2 2 .8
—
8 ,3 2 9 .5
GOODWILL AND OTHER INTANGIBLE ASSETS, NET
—
0 .7 1 6 ,3 3 1 . 9
—
1 6 ,3 3 2 .6
INVESTMENT IN SUBSIDIARIES 31,307.9 16,133.2
—
(4 7 ,4 4 1 .1 )
—
INTERCOMPANY LOANS RECEIVABLE 269.2 10,678.8
—
(1 0 ,9 4 8 .0 )
—
OTHER ASSETS 1 .4 9 .2 4 ,5 2 4 .8 (1 ,6 0 8 .9 ) 2 ,9 2 6 .5
TOTAL ASSETS $ 3 2 ,4 2 3 .0 $ 2 6 ,8 9 1 .2 $ 4 5 ,6 0 3 .1 $ (6 4 ,5 1 3 .0 ) $ 4 0 ,4 0 4 .3
CURRENT LIABILITIES:
Loans payable and current maturities of long-term debt $
—
$ 1 , 2 4 8 .9 $ 2 8 8 .3 $
—
$ 1 , 5 3 7 .2
Accounts payable 0 .3 0 .2 3 ,2 9 1 .4
—
3 ,2 9 1 .9
Accrued expenses and other current liabilities 2 5 .3 1 1 8 .3 3 ,8 9 4 .6
—
4 ,0 3 8 .2
Intercompany payables 2 ,4 4 7 .8 1 , 2 1 3 .5 8 5 3 .7 (4 ,5 1 5 .0 )
—
Other
—
0 .5 2 ,3 7 7 . 3 4 3 3 .8 2 ,8 1 1 . 6
Total current liabilities 2 ,4 7 3 .4 2 ,5 8 1 .4 1 0 ,7 0 5 .3 (4 ,0 8 1 .2 ) 1 1 ,6 7 8 .9
LONG-TERM DEBT
—
8 ,1 4 4 .3 1 , 3 1 7 .5
—
9 ,4 6 1 .8
INTERCOMPANY LOANS PAYABLE
——
1 0 ,9 4 8 .0 (1 0 ,9 4 8 .0 )
—
OTHER LONG-TERM LIABILITIES
—
3 .9 1 ,8 8 3 . 0
—
1 ,8 8 6 .9
MINORITY INTEREST
——
3 4 3 .5
—
3 4 3 .5
SHAREHOLDERS’ EQUITY:
Common shares 345.0
—
5 .1 (1 3 .2 ) 3 3 6 .9
Capital in excess:
Share premium 16,031.2
——
(1 0 ,7 9 7 .9 ) 5 ,2 3 3 .3
Contributed surplus 5 ,9 7 3 .3 1 2 , 6 6 5 .0 1 4 ,3 6 5 .6 (3 0 ,2 1 7 .6 ) 2 ,7 8 6 .3
Accumulated earnings 7 , 6 0 0 .1 3 ,4 9 6 .6 5 ,7 8 6 .0 (8 ,4 5 5 .1 ) 8 ,4 2 7 .6
Accumulated other comprehensive income
——
2 4 9 .1
—
2 4 9 .1
TOTAL SHAREHOLDERS’ EQUITY 2 9 ,9 4 9 .6 1 6 ,1 6 1 . 6 2 0 ,4 0 5 .8 (4 9 , 4 8 3 .8 ) 1 7 ,0 3 3 .2
TOTAL LIABILITIES AND SHAREHOLDERS’ EQUITY $ 3 2 ,4 2 3 .0 $ 2 6 , 8 9 1 .2 $ 4 5 ,6 0 3 .1 $ (6 4 ,5 1 3 . 0 ) $ 4 0 ,4 0 4 .3