TCF Bank 2011 Annual Report Download - page 77
Download and view the complete annual report
Please find page 77 of the 2011 TCF Bank annual report below. You can navigate through the pages in the report by either clicking on the pages listed below, or by using the keyword search tool below to find specific information within the annual report.-
 1
1 -
2
-
3
-
4
-
5
-
6
-
7
-
8
-
9
-
10
-
11
-
12
-
13
-
14
-
15
-
16
-
17
-
18
-
19
-
20
-
21
-
22
-
23
-
24
-
25
-
26
-
27
-
28
-
29
-
30
-
31
-
32
-
33
-
34
-
35
-
36
-
37
-
38
-
39
-
40
-
41
-
42
-
43
-
44
-
45
-
46
-
47
-
48
-
49
-
50
-
51
-
52
-
53
-
54
-
55
-
56
-
57
-
58
-
59
-
60
-
61
-
62
-
63
-
64
-
65
-
66
-
 67
67 -
 68
68 -
 69
69 -
 70
70 -
 71
71 -
 72
72 -
 73
73 -
 74
74 -
 75
75 -
 76
76 -
 77
77 -
 78
78 -
 79
79 -
 80
80 -
 81
81 -
 82
82 -
 83
83 -
 84
84 -
 85
85 -
 86
86 -
 87
87 -
88
-
89
-
90
-
91
-
92
-
93
-
94
-
95
-
96
-
97
-
98
-
99
-
100
-
101
-
102
-
103
-
104
-
105
-
106
-
107
-
108
-
109
-
110
-
111
-
112
-
113
-
114
-
115
-
116
-
117
-
118
-
119
-
120
-
121
-
122
-
123
-
124
-
125
-
126
-
127
-
128
-
129
-
130
-
131
-
132
-
133
-
134
-
135
-
136
-
137
-
138
-
139
-
140
 |
 |

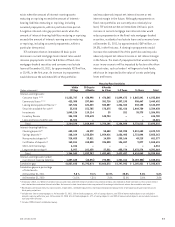
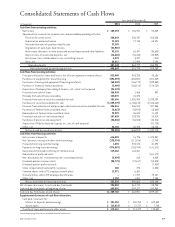
Consolidated Statements of Cash Flows
Year Ended December 31,
(In thousands) 2011 2010 2009
Cash flows from operating activities:
Net income $ 109,394 $ 150,947 $ 94,269
Adjustments to reconcile net income to net cash provided by operating activities:
Provision for credit losses 200,843 236,437 258,536
Depreciation and amortization 73,183 77,135 68,491
Proceeds from sales of auto loans held for sale 37,395 – –
Originations of auto loans held for sale (32,987) – –
Net increase (decrease) in other assets and accrued expenses and other liabilities 92,176 62,397 (34,882)
Gains on sales of assets and deposits, net (16,465) (32,483) (30,539)
Net income (loss) attributable to non-controlling interest 4,993 3,297 (410)
Other, net 28,011 17,994 3,798
Total adjustments 387,149 364,777 264,994
Net cash provided by operating activities 496,543 515,724 359,263
Cash flows from investing activities:
Principal collected on loans and leases, net of loan originations and purchases 812,988 429,228 40,158
Purchases of equipment for lease financing (894,593) (802,587) (801,569)
Purchases of leasing and equipment financing portfolios (68,848) (186,779) (339,860)
Purchase of inventory finance portfolios (5,905) (168,612) (274,722)
Acquisition of Gateway One Lending & Finance, LLC, net of cash acquired (94,323) – –
Proceeds from sales of loans 168,834 1,456 937
Proceeds from sales of lease receivables 125,072 10,670 –
Proceeds from sales of securities available for sale 181,696 1,330,955 2,293,739
Purchases of securities available for sale (1,039,379) (1,788,142) (2,436,163)
Proceeds from maturities of and principal collected on securities available for sale 586,816 436,574 327,856
Purchases of Federal Home Loan Bank stock (6,663) (34,925) (18,882)
Redemptions of Federal Home Loan Bank stock 29,093 26,042 11,129
Proceeds from sales of real estate owned 107,428 103,236 25,913
Purchases of premises and equipment (34,865) (36,088) (40,276)
Acquisition of Fidelity National Capital, Inc., net of cash acquired – – (57,728)
Other, net 34,334 32,420 28,758
Net cash used by investing activities (98,315) (646,552) (1,240,710)
Cash flows from financing activities:
Net increase in deposits 616,889 16,796 1,324,967
Net (decrease) increase in short-term borrowings (120,374) (117,814) 17,743
Proceeds from long-term borrowings 1,898 574,876 31,393
Payments on long-term borrowings (376,087) (135,704) (141,012)
Net proceeds from public offering of common stock 219,666 164,567 –
Redemption of preferred stock – – (361,172)
Net (distribution to) investment by non-controlling interest (2,999) 810 4,803
Dividends paid on common stock (30,772) (27,617) (50,828)
Dividends paid on preferred stock – – (7,925)
Stock compensation tax benefits (expenses) 280 298 (1,058)
Common shares sold to TCF employee benefit plans 17,971 6,362 –
Treasury shares sold to TCF employee benefit plans –11,727 19,147
Other, net 1,103 1,301 2,136
Net cash provided by financing activities 327,575 495,602 838,194
Net increase (decrease) in cash and due from banks 725,803 364,774 (43,253)
Cash and due from banks at beginning of year 663,901 299,127 342,380
Cash and due from banks at end of year $1,389,704 $ 663,901 $299,127
Supplemental disclosures of cash flow information:
Cash paid (received) for:
Interest on deposits and borrowings $ 231,353 $ 258,750 $ 329,609
Income taxes $ (12,012) $ 72,777 $ 7,788
Transfer of loans and leases to other assets $ 175,361 $ 214,079 $ 135,682
See accompanying notes to consolidated financial statements.
592011 Form 10-K