TCF Bank 2011 Annual Report Download - page 36
Download and view the complete annual report
Please find page 36 of the 2011 TCF Bank annual report below. You can navigate through the pages in the report by either clicking on the pages listed below, or by using the keyword search tool below to find specific information within the annual report.-
 1
1 -
2
-
3
-
4
-
5
-
6
-
7
-
8
-
9
-
10
-
11
-
12
-
13
-
14
-
15
-
16
-
17
-
18
-
19
-
20
-
21
-
22
-
23
-
24
-
25
-
 26
26 -
 27
27 -
 28
28 -
 29
29 -
 30
30 -
 31
31 -
 32
32 -
 33
33 -
 34
34 -
 35
35 -
 36
36 -
 37
37 -
 38
38 -
 39
39 -
 40
40 -
 41
41 -
 42
42 -
 43
43 -
 44
44 -
 45
45 -
 46
46 -
47
-
48
-
49
-
50
-
51
-
52
-
53
-
54
-
55
-
56
-
57
-
58
-
59
-
60
-
61
-
62
-
63
-
64
-
65
-
66
-
67
-
68
-
69
-
70
-
71
-
72
-
73
-
74
-
75
-
76
-
77
-
78
-
79
-
80
-
81
-
82
-
83
-
84
-
85
-
86
-
87
-
88
-
89
-
90
-
91
-
92
-
93
-
94
-
95
-
96
-
97
-
98
-
99
-
100
-
101
-
102
-
103
-
104
-
105
-
106
-
107
-
108
-
109
-
110
-
111
-
112
-
113
-
114
-
115
-
116
-
117
-
118
-
119
-
120
-
121
-
122
-
123
-
124
-
125
-
126
-
127
-
128
-
129
-
130
-
131
-
132
-
133
-
134
-
135
-
136
-
137
-
138
-
139
-
140
 |
 |

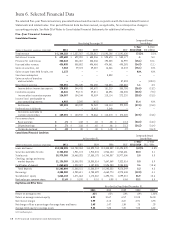
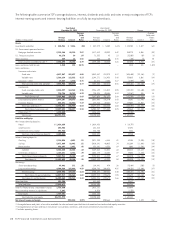
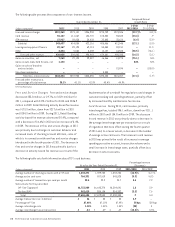
Item 6. Selected Financial Data
The selected five-year financial summary presented below should be read in conjunction with the Consolidated Financial
Statements and related notes. Prior period financial data has been revised, as applicable, for a retrospective change in
accounting principle. See Note 28 of Notes to Consolidated Financial Statements for additional information.
Five-Year Financial Summary
Consolidated Income:
Year Ended December 31,
Compound Annual
Growth Rate
(Dollars in thousands, except per-share data) 2011 2010 2009 2008 2007
1-Year
2011/2010
5-Year
2011/2006
Total revenue $ 1,144,122 $ 1,237,187 $1,158,861 $1,092,108 $ 1,091,634 (7.5)% 2.2%
Net interest income $ 699,688 $ 699,202 $ 633,006 $ 593,673 $ 550,177 .1 5.4
Provision for credit losses 200,843 236,437 258,536 192,045 56,992 (15.1) 57.6
Fees and other revenue 436,038 508,862 496,468 474,061 490,285 (14.3) (2.1)
Gains on securities, net 7,263 29,123 29,387 16,066 13,278 (75.1) N.M.
Gains on auto loans held for sale, net 1,133 – – – – N.M. N.M.
Visa share redemption – – – 8,308 – – –
Gains on sales of branches
and real estate – – – – 37,894 – (100.0)
Non-interest expense 764,451 756,335 756,655 718,853 653,887 1.1 3.5
Income before income tax expense 178,828 244,415 143,670 181,210 380,755 (26.8) (13.2)
Income tax expense 64,441 90,171 49,811 68,096 108,535 (28.5) (9.3)
Income after income tax expense 114,387 154,244 93,859 113,114 272,220 (25.8) (15.0)
Income (loss) attributable to
non-controlling interest 4,993 3,297 (410) – – 51.4 N.M.
Net Income 109,394 150,947 94,269 113,114 272,220 (27.5) (15.8)
Preferred stock dividends – – 18,403 2,540 – – –
Net income available to
common stockholders $ 109,394 $ 150,947 $ 75,866 $ 110,574 $ 272,220 (27.5) (15.8)
Per common share:
Basic earnings $ .71 $ 1.08 $ .60 $ .88 $ 2.13 (34.3) (18.4)
Diluted earnings $ .71 $ 1.08 $ .60 $ .88 $ 2.13 (34.3) (18.4)
Dividends declared $ .20 $ .20 $ .40 $ 1.00 $ .97 – (26.3)
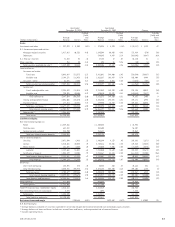
Consolidated Financial Condition:
At December 31,
Compound Annual
Growth Rate
(Dollars in thousands, except per-share data) 2011 2010 2009 2008 2007
1-Year
2011/2010
5-Year
2011/2006
Loans and leases $14,150,255 $14,788,304 $14,590,744 $13,345,889 $12,494,370 (4.3)% 4.3%
Securities available for sale 2,324,038 1,931,174 1,910,476 1,966,104 1,963,681 20.3 5.1
Total assets 18,979,388 18,465,025 17,885,175 16,740,357 15,977,054 2.8 5.3
Checking, savings and money
market deposits 11,136,389 10,556,788 10,380,814 7,647,069 7,322,014 5.5 8.9
Certificates of deposit 1,065,615 1,028,327 1,187,505 2,596,283 2,254,535 3.6 (15.6)
Total deposits 12,202,004 11,585,115 11,568,319 10,243,352 9,576,549 5.3 4.5
Borrowings 4,388,080 4,985,611 4,755,499 4,660,774 4,973,448 (12.0) 4.1
Stockholders’ equity 1,868,133 1,471,663 1,175,362 1,493,776 1,099,012 26.9 12.6
Book value per common share $ 11.65 $ 10.30 $ 9.10 $ 8.99 $ 8.68 13.1 8.0
Key Ratios and Other Data:
At or For the Year Ended December 31,
2011 2010 2009 2008 2007
Return on average assets .61% .85% .54% .69% 1.80%
Return on average common equity 6.32 10.67 6.57 10.03 26.34
Net interest margin 3.99 4.15 3.87 3.91 3.94
Net charge-offs as a percentage of average loans and leases 1.45 1.47 1.34 .78 .29
Average total equity to average assets 9.24 7.83 7.20 7.04 6.82
N.M. Not Meaningful.
18 TCF Financial Corporation and Subsidiaries