TCF Bank 2011 Annual Report Download - page 51
Download and view the complete annual report
Please find page 51 of the 2011 TCF Bank annual report below. You can navigate through the pages in the report by either clicking on the pages listed below, or by using the keyword search tool below to find specific information within the annual report.-
 1
1 -
2
-
3
-
4
-
5
-
6
-
7
-
8
-
9
-
10
-
11
-
12
-
13
-
14
-
15
-
16
-
17
-
18
-
19
-
20
-
21
-
22
-
23
-
24
-
25
-
26
-
27
-
28
-
29
-
30
-
31
-
32
-
33
-
34
-
35
-
36
-
37
-
38
-
39
-
40
-
 41
41 -
 42
42 -
 43
43 -
 44
44 -
 45
45 -
 46
46 -
 47
47 -
 48
48 -
 49
49 -
 50
50 -
 51
51 -
 52
52 -
 53
53 -
 54
54 -
 55
55 -
 56
56 -
 57
57 -
 58
58 -
 59
59 -
 60
60 -
 61
61 -
62
-
63
-
64
-
65
-
66
-
67
-
68
-
69
-
70
-
71
-
72
-
73
-
74
-
75
-
76
-
77
-
78
-
79
-
80
-
81
-
82
-
83
-
84
-
85
-
86
-
87
-
88
-
89
-
90
-
91
-
92
-
93
-
94
-
95
-
96
-
97
-
98
-
99
-
100
-
101
-
102
-
103
-
104
-
105
-
106
-
107
-
108
-
109
-
110
-
111
-
112
-
113
-
114
-
115
-
116
-
117
-
118
-
119
-
120
-
121
-
122
-
123
-
124
-
125
-
126
-
127
-
128
-
129
-
130
-
131
-
132
-
133
-
134
-
135
-
136
-
137
-
138
-
139
-
140
 |
 |

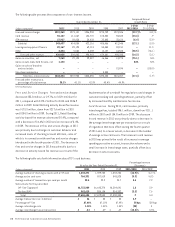
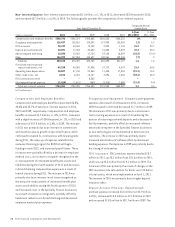
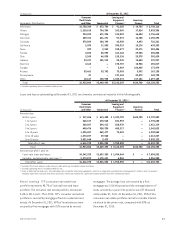
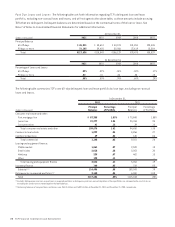
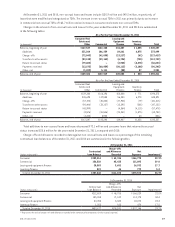
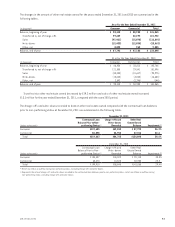
Leasing and Equipment Finance The following tables summarize TCF’s leasing and equipment finance portfolio by
marketing segment and by equipment type, excluding operating leases.
At December 31,
(Dollars in thousands) 2011 2010
Market Segment Balance
Percent
of Total Balance
Percent
of Total
Middle market (1) $1,641,898 52.3% $1,632,829 51.8%
Small ticket (2) 865,169 27.5 833,053 26.4
Winthrop 448,822 14.3 530,063 16.8
Other 186,370 5.9 158,533 5.0
Total $3,142,259 100.0% $3,154,478 100.0%
(1)Middle market consists primarily of loan and lease financing of construction and manufacturing equipment and specialty vehicles.
(2) Small ticket includes loan and lease financings to small- and mid-size companies through programs with vendors, manufacturers,distributors, buying groups,
and franchise organizations.
At December 31,
(Dollars in thousands) 2011 2010
Equipment Type Balance
Percent
of Total Balance
Percent
of Total
Specialty vehicles $ 693,435 22.1% $ 624,149 19.8%
Manufacturing 476,963 15.2 567,622 18.0
Medical 424,591 13.5 432,973 13.7
Construction 336,563 10.7 349,841 11.1
Golf cart and turf 296,871 9.4 211,796 6.7
Technology and data processing 286,596 9.1 321,279 10.2
Furniture and fixtures 169,004 5.4 162,131 5.1
Exercise equipment 95,981 3.1 99,342 3.1
Printing 74,309 2.4 84,187 2.7
Other 287,946 9.1 301,158 9.6
Total $3,142,259 100.0% $3,154,478 100.0%
The leasing and equipment finance portfolio was
$3.1 billion at December 31, 2011, relatively flat with
December 31, 2010, and consisted of $2 billion of leases
and $1.1 billion of loans. Total loan and lease originations
within TCF’s leasing and equipment finance portfolios
were $1.5 billion for 2011, an increase of 17.8% from
$1.3 billion in 2010. Total loan and lease purchases within
TCF’s leasing and equipment finance portfolios were
$67.1 million within the small ticket segment during 2011,
compared with $186.8 million within the middle market
segment during 2010. The backlog of approved transactions
was $455.3 million at December 31, 2011, compared with
$402.6 million at December 31, 2010. The average size of
transactions originated during 2011 was $93.9 thousand,
compared with $81.6 thousand during 2010. TCF’s leasing
and equipment finance activity is subject to risk of cyclical
downturns and other adverse economic developments. In
an adverse economic environment, there may be a decline
in the demand for some types of equipment, resulting in
a decline in the amount of new equipment being placed
into service as well as a decline in equipment values for
equipment previously placed in service. Declines in the value
of leased equipment increase the potential for impairment
losses and credit losses due to diminished collateral value,
and may result in lower sales-type revenue at the end of the
contractual lease term. See Note 1 of Notes to Consolidated
Financial Statements — Summary of Significant Accounting
Policies — Policies Related to Critical Accounting Estimates
for information on lease accounting.
At December 31, 2011 and 2010, $121.7 million and
$212.4 million, respectively, of TCF’s lease portfolio was
discounted on a non-recourse basis with third-party
financial institutions and, consequently, TCF retains no
credit risk on such amounts. The leasing and equipment
finance portfolio tables above include lease residuals.
Lease residuals represent the estimated fair value of the
leased equipment at the expiration of the initial term of
the transaction and are reviewed on an ongoing basis. Any
downward revisions in estimated fair value are recorded in
the periods in which they become known. At December 31,
2011, lease residuals totaled $129.1 million, or 11.2% of
original equipment value, compared with $109.6 million, or
10.1% of original equipment value, at December 31, 2010.
332011 Form 10-K