TCF Bank 2011 Annual Report Download - page 61
Download and view the complete annual report
Please find page 61 of the 2011 TCF Bank annual report below. You can navigate through the pages in the report by either clicking on the pages listed below, or by using the keyword search tool below to find specific information within the annual report.-
 1
1 -
2
-
3
-
4
-
5
-
6
-
7
-
8
-
9
-
10
-
11
-
12
-
13
-
14
-
15
-
16
-
17
-
18
-
19
-
20
-
21
-
22
-
23
-
24
-
25
-
26
-
27
-
28
-
29
-
30
-
31
-
32
-
33
-
34
-
35
-
36
-
37
-
38
-
39
-
40
-
41
-
42
-
43
-
44
-
45
-
46
-
47
-
48
-
49
-
50
-
 51
51 -
 52
52 -
 53
53 -
 54
54 -
 55
55 -
 56
56 -
 57
57 -
 58
58 -
 59
59 -
 60
60 -
 61
61 -
 62
62 -
 63
63 -
 64
64 -
 65
65 -
 66
66 -
 67
67 -
 68
68 -
 69
69 -
 70
70 -
 71
71 -
72
-
73
-
74
-
75
-
76
-
77
-
78
-
79
-
80
-
81
-
82
-
83
-
84
-
85
-
86
-
87
-
88
-
89
-
90
-
91
-
92
-
93
-
94
-
95
-
96
-
97
-
98
-
99
-
100
-
101
-
102
-
103
-
104
-
105
-
106
-
107
-
108
-
109
-
110
-
111
-
112
-
113
-
114
-
115
-
116
-
117
-
118
-
119
-
120
-
121
-
122
-
123
-
124
-
125
-
126
-
127
-
128
-
129
-
130
-
131
-
132
-
133
-
134
-
135
-
136
-
137
-
138
-
139
-
140
 |
 |

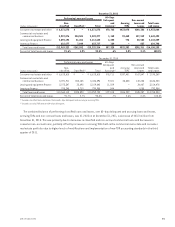
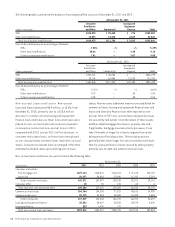
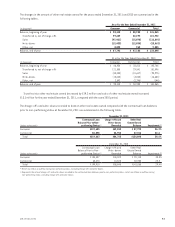
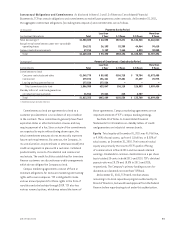
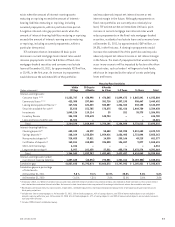
The changes in the amount of other real estate owned for the years ended December 31, 2011 and 2010 are summarized in the
following tables.
At or For the Year Ended December 31, 2011
(In thousands) Consumer Commercial Total
Balance, beginning of year $ 90,115 $ 50,950 $ 141,065
Transferred in, net of charge-offs 99,639 22,293 121,932
Sales (97,021) (15,070) (112,091)
Write-downs (13,033) (12,030) (25,063)
Other, net 8,092 963 9,055
Balance, end of year $ 87,792 $ 47,106 $ 134,898
At or For the Year Ended December 31, 2010
(In thousands) Consumer Commercial Total
Balance, beginning of year $ 66,956 $ 38,812 $ 105,768
Transferred in, net of charge-offs 121,555 29,541 151,096
Sales (88,358) (10,617) (98,975)
Write-downs (12,640) (4,040) (16,680)
Other, net 2,602 (2,746) (144)
Balance, end of year $ 90,115 $ 50,950 $ 141,065
Transfers into other real estate owned decreased by $29.2 million and sales of other real estate owned increased
$13.1 million for the year ended December 31, 2011, compared with the same 2010 period.
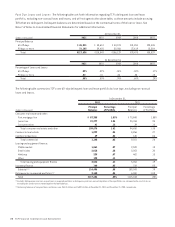
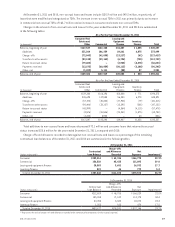
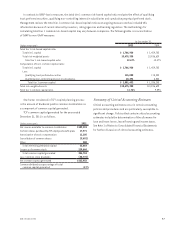
The charge-offs and write-downs recorded to date on other real estate owned compared with the contractual loan balances
prior to non-performing status at December 31, 2011 are summarized in the following table.
December 31, 2011
(Dollars in thousands)
Contractual Loan
Balance Prior to Non-
performing Status(1)
Charge-offs and
Write-downs
Recorded
Other Real
Estate Owned
Balance Impairment (2)
Consumer $137,605 $49,813 $ 87,792 36.2%
Commercial 82,058 34,952 47,106 42.6
Total $219,663 $84,765 $134,898 38.6%
December 31, 2010
(Dollars in thousands)
Contractual Loan
Balance Prior to Non-
performing Status(1)
Charge-offs and
Write-downs
Recorded
Other Real
Estate Owned
Balance Impairment (2)
Consumer $ 134,437 $ 44,322 $ 90,115 33.0%
Commercial 65,473 14,523 50,950 22.2
Total $ 199,910 $58,845 $141,065 29.4%
(1) Net of any inflows or outflows during non-performing status, excluding charge-offs and write-downs.
(2) Represents the ratio of charge-offs and write-downs recorded to the contractual loan balances prior to non-performing status, net of any inflows or outflows during
non-performing status, excluding charge-offs and write-downs.
432011 Form 10-K