TCF Bank 2011 Annual Report Download - page 2
Download and view the complete annual report
Please find page 2 of the 2011 TCF Bank annual report below. You can navigate through the pages in the report by either clicking on the pages listed below, or by using the keyword search tool below to find specific information within the annual report.-
 1
1 -
 2
2 -
 3
3 -
 4
4 -
 5
5 -
 6
6 -
 7
7 -
 8
8 -
 9
9 -
 10
10 -
 11
11 -
 12
12 -
 13
13 -
14
-
15
-
16
-
17
-
18
-
19
-
20
-
21
-
22
-
23
-
24
-
25
-
26
-
27
-
28
-
29
-
30
-
31
-
32
-
33
-
34
-
35
-
36
-
37
-
38
-
39
-
40
-
41
-
42
-
43
-
44
-
45
-
46
-
47
-
48
-
49
-
50
-
51
-
52
-
53
-
54
-
55
-
56
-
57
-
58
-
59
-
60
-
61
-
62
-
63
-
64
-
65
-
66
-
67
-
68
-
69
-
70
-
71
-
72
-
73
-
74
-
75
-
76
-
77
-
78
-
79
-
80
-
81
-
82
-
83
-
84
-
85
-
86
-
87
-
88
-
89
-
90
-
91
-
92
-
93
-
94
-
95
-
96
-
97
-
98
-
99
-
100
-
101
-
102
-
103
-
104
-
105
-
106
-
107
-
108
-
109
-
110
-
111
-
112
-
113
-
114
-
115
-
116
-
117
-
118
-
119
-
120
-
121
-
122
-
123
-
124
-
125
-
126
-
127
-
128
-
129
-
130
-
131
-
132
-
133
-
134
-
135
-
136
-
137
-
138
-
139
-
140
 |
 |

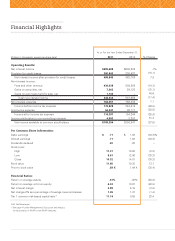
Financial Highlights
At or For the Year Ended December 31,
(Dollars in thousands, except per-share data) 2011 2010 % Change
Operating Results:
Net interest income $699,688 $699,202 .1%
Provision for credit losses 200,843 236,437 (15.1)
Net interest income after provision for credit losses 498,845 462,765 7.8
Non-interest income:
Fees and other revenue 436,038 508,862 (14.3)
Gains on securities, net 7,263 29,123 (75.1)
Gains on auto loans held for sale, net 1,133 – N.M.
Total non-interest income 444,434 537,985 (17.4)
Non-interest expense 764,451 756,335 1.1
Income before income tax expense 178,828 244,415 (26.8)
Income tax expense 64,441 90,171 (28.5)
Income after income tax expense 114,387 154,244 (25.8)
Income attributable to non-controlling interests 4,993 3,297 51.4
Net income available to common stockholders $109,394 $150,947 (27.5)
Per Common Share Information:
Basic earnings $ .71 $ 1.08 (34.3)%
Diluted earnings .71 1.08 (34.3)
Dividends declared .20 .20 –
Stock price:
High 17.37 18.89 (8.0)
Low 8.61 12.90 (33.3)
Close 10.32 14.81 (30.3)
Book value 11.65 10.30 13.1
Price to book value .89 X 1.44 X (38.4)
Financial Ratios:
Return on average assets .61% .85% (28.2)
Return on average common equity 6.32 10.67 (40.8)
Net interest margin 3.99 4.15 (3.9)
Net charge-offs as a percentage of average loans and leases 1.45 1.47 (1.4)
Tier 1 common risk-based capital ratio
(1) 11.74 9.59 22.4
N.M. Not Meaningful
(1) See page 47 under Management’s Discussion and Analysis
for reconcilation of GAAP to non-GAAP measures.