TCF Bank 2011 Annual Report Download - page 75
Download and view the complete annual report
Please find page 75 of the 2011 TCF Bank annual report below. You can navigate through the pages in the report by either clicking on the pages listed below, or by using the keyword search tool below to find specific information within the annual report.-
 1
1 -
2
-
3
-
4
-
5
-
6
-
7
-
8
-
9
-
10
-
11
-
12
-
13
-
14
-
15
-
16
-
17
-
18
-
19
-
20
-
21
-
22
-
23
-
24
-
25
-
26
-
27
-
28
-
29
-
30
-
31
-
32
-
33
-
34
-
35
-
36
-
37
-
38
-
39
-
40
-
41
-
42
-
43
-
44
-
45
-
46
-
47
-
48
-
49
-
50
-
51
-
52
-
53
-
54
-
55
-
56
-
57
-
58
-
59
-
60
-
61
-
62
-
63
-
64
-
 65
65 -
 66
66 -
 67
67 -
 68
68 -
 69
69 -
 70
70 -
 71
71 -
 72
72 -
 73
73 -
 74
74 -
 75
75 -
 76
76 -
 77
77 -
 78
78 -
 79
79 -
 80
80 -
 81
81 -
 82
82 -
 83
83 -
 84
84 -
 85
85 -
86
-
87
-
88
-
89
-
90
-
91
-
92
-
93
-
94
-
95
-
96
-
97
-
98
-
99
-
100
-
101
-
102
-
103
-
104
-
105
-
106
-
107
-
108
-
109
-
110
-
111
-
112
-
113
-
114
-
115
-
116
-
117
-
118
-
119
-
120
-
121
-
122
-
123
-
124
-
125
-
126
-
127
-
128
-
129
-
130
-
131
-
132
-
133
-
134
-
135
-
136
-
137
-
138
-
139
-
140
 |
 |

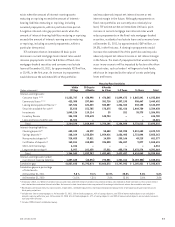
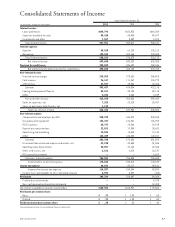
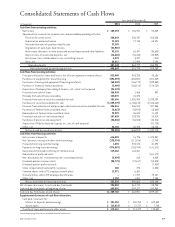
Consolidated Statements of Income
Year Ended December 31,
(In thousands, except per-share data) 2011 2010 2009
Interest income:
Loans and leases $844,796 $883,923 $864,384
Securities available for sale 85,188 80,445 89,427
Investments and other 7,967 5,509 4,370
Total interest income 937,951 969,877 958,181
Interest expense:
Deposits 45,108 61,229 122,112
Borrowings 193,155 209,446 203,063
Total interest expense 238,263 270,675 325,175
Net interest income 699,688 699,202 633,006
Provision for credit losses 200,843 236,437 258,536
Net interest income after provision for credit losses 498,845 462,765 374,470
Non-interest income:
Fees and service charges 219,363 273,181 286,908
Card revenue 96,147 111,067 104,770
ATM revenue 27,927 29,836 30,438
Subtotal 343,437 414,084 422,116
Leasing and equipment finance 89,167 89,194 69,113
Other 3,434 5,584 5,239
Fees and other revenue 436,038 508,862 496,468
Gains on securities, net 7,263 29,123 29,387
Gains on auto loans held for sale, net 1,133 – –
Total non-interest income 444,434 537,985 525,855
Non-interest expense:
Compensation and employee benefits 348,792 346,072 345,868
Occupancy and equipment 126,437 126,551 126,292
FDIC insurance 28,747 23,584 19,109
Deposit account premiums 22,891 17,304 30,682
Advertising and marketing 10,034 13,062 17,134
Other 145,489 146,253 142,817
Subtotal 682,390 672,826 681,902
Foreclosed real estate and repossessed assets, net 49,238 40,385 31,886
Operating lease depreciation 30,007 37,106 22,368
Other credit costs, net 2,816 6,018 12,137
FDIC special assessment – – 8,362
Total non-interest expense 764,451 756,335 756,655
Income before income tax expense 178,828 244,415 143,670
Income tax expense 64,441 90,171 49,811
Income after income tax expense 114,387 154,244 93,859
Income (loss) attributable to non-controlling interest 4,993 3,297 (410)
Net income 109,394 150,947 94,269
Preferred stock dividends – – 6,378
Non-cash deemed preferred stock dividend – – 12,025
Net income available to common stockholders $109,394 $150,947 $ 75,866
Net income per common share:
Basic $ .71 $ 1.08 $ .60
Diluted $ .71 $ 1.08 $ .60
Dividends declared per common share $ .20 $ .20 $ .40
See accompanying notes to consolidated financial statements.
572011 Form 10-K