TCF Bank 2011 Annual Report Download - page 38
Download and view the complete annual report
Please find page 38 of the 2011 TCF Bank annual report below. You can navigate through the pages in the report by either clicking on the pages listed below, or by using the keyword search tool below to find specific information within the annual report.-
 1
1 -
2
-
3
-
4
-
5
-
6
-
7
-
8
-
9
-
10
-
11
-
12
-
13
-
14
-
15
-
16
-
17
-
18
-
19
-
20
-
21
-
22
-
23
-
24
-
25
-
26
-
27
-
 28
28 -
 29
29 -
 30
30 -
 31
31 -
 32
32 -
 33
33 -
 34
34 -
 35
35 -
 36
36 -
 37
37 -
 38
38 -
 39
39 -
 40
40 -
 41
41 -
 42
42 -
 43
43 -
 44
44 -
 45
45 -
 46
46 -
 47
47 -
 48
48 -
49
-
50
-
51
-
52
-
53
-
54
-
55
-
56
-
57
-
58
-
59
-
60
-
61
-
62
-
63
-
64
-
65
-
66
-
67
-
68
-
69
-
70
-
71
-
72
-
73
-
74
-
75
-
76
-
77
-
78
-
79
-
80
-
81
-
82
-
83
-
84
-
85
-
86
-
87
-
88
-
89
-
90
-
91
-
92
-
93
-
94
-
95
-
96
-
97
-
98
-
99
-
100
-
101
-
102
-
103
-
104
-
105
-
106
-
107
-
108
-
109
-
110
-
111
-
112
-
113
-
114
-
115
-
116
-
117
-
118
-
119
-
120
-
121
-
122
-
123
-
124
-
125
-
126
-
127
-
128
-
129
-
130
-
131
-
132
-
133
-
134
-
135
-
136
-
137
-
138
-
139
-
140
 |
 |
Net interest income, the difference between interest
income earned on loans and leases, securities available
for sale, investments and other interest-earning assets
and interest paid on deposits and borrowings, represented
61.2% of TCF’s total revenue in 2011. Net interest income
can change significantly from period to period based on
general levels of interest rates, customer prepayment
patterns, the mix of interest-earning assets and the mix
of interest-bearing and non-interest bearing deposits
and borrowings. TCF manages the risk of changes in
interest rates on its net interest income through an Asset/
Liability Committee and through related interest-rate
risk monitoring and management policies. See “Item 1A.
Risk Factors” and “Item 7A. Quantitative and Qualitative
Disclosures about Market Risk” for further discussion.
Non-interest income is a significant source of revenue
for TCF and an important factor in TCF’s results of
operations. Increasing fee and service charge revenue
has been challenging as a result of economic conditions,
changing customer behavior and the impact of the
implementation of new regulation. Providing a wide range
of retail banking services is an integral component of TCF’s
business philosophy and a major strategy for generating
additional non-interest income. Key drivers of non-interest
income are the number of deposit accounts and related
transaction activity.
In response to new regulations, TCF introduced a new
anchor checking account product that replaced the TCF
Totally Free Checking product. The new product carries
a monthly maintenance fee on accounts not meeting
certain specific requirements. In addition, the success of
the Michigan pilot of TCF’s daily overdraft product did not
transfer well to other markets. As a result, TCF introduced
additional overdraft product options in 2012.
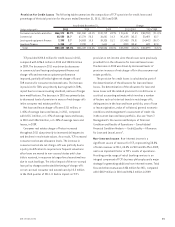
The Company’s Visa® debit card program has grown
significantly since its inception in 1996. TCF is the 15th
largest issuer of Visa consumer debit cards in the United
States, based on payments volume for the three months
ended September 30, 2011, as published by Visa. TCF earns
interchange revenue from customer card transactions paid
primarily by merchants, not TCF’s customers. Card products
represent 27.1% of banking fee revenue for the year ended
December 31, 2011. Visa has significant litigation against
it regarding interchange pricing and there is a risk this
revenue could be impacted by any settlement or adverse
rulings in such litigation.
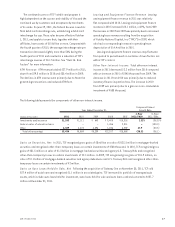
TCF’s card revenues have been impacted by the Durbin
Amendment to the Dodd-Frank Wall Street and Consumer
Protection Act of 2010 (the “Dodd-Frank Act”), which
directed the Board of Governors of the Federal Reserve
System (“Federal Reserve”) to establish rules related to
debit-card interchange fees. The final rule, which became
effective on October 1, 2011, sets a base interchange fee
limit of 21 cents, plus a per transaction component of 5
basis points, and a one cent charge if issuers comply with
certain fraud protection provisions. This rule resulted in a
$14.7 million, or slightly more than 50%, reduction in TCF’s
card interchange revenue during the fourth quarter of 2011.
See “Item 1A. Risk Factors” and “Item 7. Management’s
Discussion and Analysis of Financial Condition and Results
of Operations — Consolidated Income Statement Analysis”
for more information.
On November 30, 2011, TCF’s wholly-owned subsidiary,
TCF Bank, completed the acquisition of Gateway One.
Headquartered in Anaheim, California, Gateway One utilizes
its more than 3,400 active dealer relationships to originate
loans and services to consumers in 30 states on new and
used autos. As part of the acquisition, TCF is retaining
Gateway One’s seasoned executive management team. The
addition of Gateway One further diversifies TCF’s lending
business and provides ample growth opportunities within
the U.S. auto lending marketplace, the second largest
consumer finance market in the U.S.
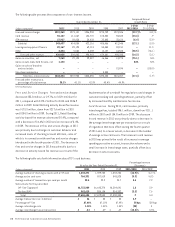
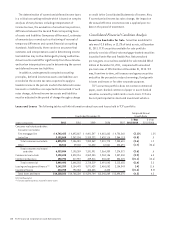
The following portions of Management’s Discussion and
Analysis of Financial Condition and Results of Operations
focus in more detail on the results of operations for 2011,
2010 and 2009 and on information about TCF’s balance
sheet, loan and lease portfolio, liquidity, funding resources,
capital and other matters.
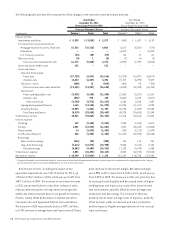
Results of Operations
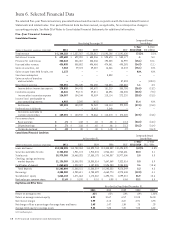
Performance Summary TCF reported diluted earnings
per common share of $.71 for 2011, compared with $1.08
for 2010 and $.60 for 2009. Net income was $109.4 million
for 2011, compared with $150.9 million for 2010 and
$94.3 million for 2009. Net income available to common
stockholders for 2009 includes a non-cash deemed
preferred stock dividend of $12 million, or 9 cents per
common share.
Return on average assets was .61% in 2011, compared with
.85% in 2010 and .54% in 2009. Return on average common
equity was 6.32% in 2011, compared with 10.67% in 2010
and 6.57% in 2009. The effective income tax rate for 2011
was 36%, compared with 36.9% in 2010 and 34.7% in 2009.
20 TCF Financial Corporation and Subsidiaries