TCF Bank 2011 Annual Report Download - page 46
Download and view the complete annual report
Please find page 46 of the 2011 TCF Bank annual report below. You can navigate through the pages in the report by either clicking on the pages listed below, or by using the keyword search tool below to find specific information within the annual report.-
 1
1 -
2
-
3
-
4
-
5
-
6
-
7
-
8
-
9
-
10
-
11
-
12
-
13
-
14
-
15
-
16
-
17
-
18
-
19
-
20
-
21
-
22
-
23
-
24
-
25
-
26
-
27
-
28
-
29
-
30
-
31
-
32
-
33
-
34
-
35
-
 36
36 -
 37
37 -
 38
38 -
 39
39 -
 40
40 -
 41
41 -
 42
42 -
 43
43 -
 44
44 -
 45
45 -
 46
46 -
 47
47 -
 48
48 -
 49
49 -
 50
50 -
 51
51 -
 52
52 -
 53
53 -
 54
54 -
 55
55 -
 56
56 -
57
-
58
-
59
-
60
-
61
-
62
-
63
-
64
-
65
-
66
-
67
-
68
-
69
-
70
-
71
-
72
-
73
-
74
-
75
-
76
-
77
-
78
-
79
-
80
-
81
-
82
-
83
-
84
-
85
-
86
-
87
-
88
-
89
-
90
-
91
-
92
-
93
-
94
-
95
-
96
-
97
-
98
-
99
-
100
-
101
-
102
-
103
-
104
-
105
-
106
-
107
-
108
-
109
-
110
-
111
-
112
-
113
-
114
-
115
-
116
-
117
-
118
-
119
-
120
-
121
-
122
-
123
-
124
-
125
-
126
-
127
-
128
-
129
-
130
-
131
-
132
-
133
-
134
-
135
-
136
-
137
-
138
-
139
-
140
 |
 |

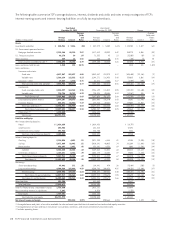
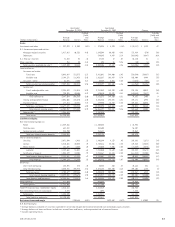
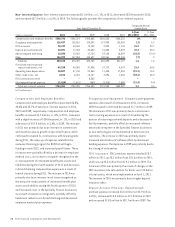
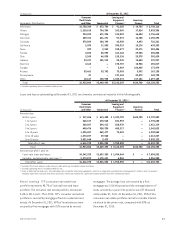
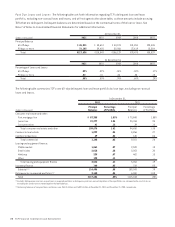
Non-Interest Expense Non-interest expense increased $8.1 million, or 1.1%, in 2011, decreased $320 thousand in 2010,
and increased $37.8 million, or 5.3%, in 2009. The following table presents the components of non-interest expense.
Year Ended December 31,
Compound Annual
Growth Rate
(Dollars in thousands) 2011 2010 2009 2008 2007
1-Year
2011/2010
5-Year
2011/2006
Compensation and employee benefits $348,792 $346,072 $345,868 $365,653 $338,232 .8% .8%
Occupancy and equipment 126,437 126,551 126,292 127,953 120,824 (.1) 2.0
FDIC insurance 28,747 23,584 19,109 2,990 1,145 21.9 90.7
Deposit account premiums 22,891 17,304 30,682 16,888 4,849 32.3 35.3
Advertising and marketing 10,034 13,062 17,134 19,150 16,829 (23.2) (14.4)
Other 146,909 147,884 143,697 150,061 139,248 (.7) .2
Subtotal 683,810 674,457 682,782 682,695 621,127 1.4 1.8
Foreclosed real estate and
repossessed assets, net 49,238 40,385 31,886 19,170 5,673 21.9 63.8
Operating lease depreciation 30,007 37,106 22,368 17,458 17,588 (19.1) 15.9
Other credit costs, net 2,816 6,018 12,137 3,296 1,803 (53.2) 48.0
FDIC special assessment – – 8,362 – – – –
Visa indemnification expense (1,420) (1,631) (880) (3,766) 7,696 (12.9) N.M.
Total non-interest expense $764,451 $756,335 $756,655 $718,853 $653,887 1.1 3.5
N.M. Not Meaningful.
Compensation and Employee Benefits
Compensation and employee benefits represented 45.6%,
45.8% and 45.7% of total non-interest expense in 2011,
2010 and 2009, respectively. Compensation and employee
benefits increased $2.7 million, or .8%, in 2011, compared
with a slight increase of $204 thousand, or .1%, in 2010 and
a decrease of $19.8 million, or 5.4%, in 2009. The increase
in 2011 was primarily due to an increase in commissions
and incentives due to growth in Specialty Finance, which
continued to expand its core business with new programs
during 2011, the ramp-up of expenses related to the
exclusive financing program for BRP that will begin
funding in early 2012, and increased payroll taxes. These
increases were partially offset by a decrease in employee
medical costs, an increase in net gains recognized on the
re-measurement of retirement benefit plan assets and
liabilities during the fourth quarter of 2011 and decreases
in branch banking compensation expense as a result of
branch closures during 2011. The increase in 2010 was
primarily due to an increase in net losses recognized on
the annual re-measurement of retirement benefit plan
assets and liabilities during the fourth quarter of 2010,
and increased costs in the Specialty Finance businesses
as a result of expansion and growth, partially offset by
headcount reductions in branch banking and decreased
employee medical plan expenses.
Occupancy and Equipment Occupancy and equipment
expenses decreased $114 thousand in 2011, increased
$259 thousand in 2010 and decreased $1.7 million in 2009.
The decrease in 2011 was primarily due to a decrease in
cash servicing expenses as a result of streamlining the
process of balancing cash and deposits and a decrease in
facility expenses, partially offset by increased software
amortization expense in the Specialty Finance businesses
as new technologies are implemented to better service
customers. The increase in 2010 was primarily due to
increased amortization of software offset by decreased
building expenses. The decrease in 2009 was primarily due to
the closing of six branches.
FDIC Insurance FDIC premiums expense totaled $28.7
million in 2011, up $5.2 million from $23.6 million in 2010,
which was up $4.5 million from $19.1 million in 2009. The
increase in 2011 was primarily the result of changes in the
FDIC insurance rate calculations for banks over $10 billion
in total assets, which were implemented on April 1, 2011.
The increase in 2010 was primarily due to higher deposit
insurance rates.
Deposit Account Premiums Deposit account
premium expense increased $5.6 million to $22.9 million
in 2011, decreased $13.4 million to $17.3 million in 2010
and increased $13.8 million to $30.7 million in 2009. The
28 TCF Financial Corporation and Subsidiaries