TCF Bank 2011 Annual Report Download - page 49
Download and view the complete annual report
Please find page 49 of the 2011 TCF Bank annual report below. You can navigate through the pages in the report by either clicking on the pages listed below, or by using the keyword search tool below to find specific information within the annual report.-
 1
1 -
2
-
3
-
4
-
5
-
6
-
7
-
8
-
9
-
10
-
11
-
12
-
13
-
14
-
15
-
16
-
17
-
18
-
19
-
20
-
21
-
22
-
23
-
24
-
25
-
26
-
27
-
28
-
29
-
30
-
31
-
32
-
33
-
34
-
35
-
36
-
37
-
38
-
 39
39 -
 40
40 -
 41
41 -
 42
42 -
 43
43 -
 44
44 -
 45
45 -
 46
46 -
 47
47 -
 48
48 -
 49
49 -
 50
50 -
 51
51 -
 52
52 -
 53
53 -
 54
54 -
 55
55 -
 56
56 -
 57
57 -
 58
58 -
 59
59 -
60
-
61
-
62
-
63
-
64
-
65
-
66
-
67
-
68
-
69
-
70
-
71
-
72
-
73
-
74
-
75
-
76
-
77
-
78
-
79
-
80
-
81
-
82
-
83
-
84
-
85
-
86
-
87
-
88
-
89
-
90
-
91
-
92
-
93
-
94
-
95
-
96
-
97
-
98
-
99
-
100
-
101
-
102
-
103
-
104
-
105
-
106
-
107
-
108
-
109
-
110
-
111
-
112
-
113
-
114
-
115
-
116
-
117
-
118
-
119
-
120
-
121
-
122
-
123
-
124
-
125
-
126
-
127
-
128
-
129
-
130
-
131
-
132
-
133
-
134
-
135
-
136
-
137
-
138
-
139
-
140
 |
 |

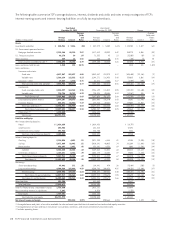
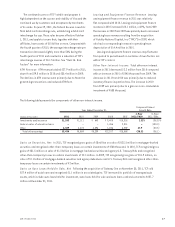
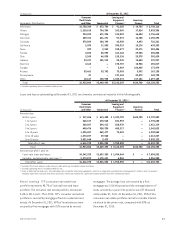
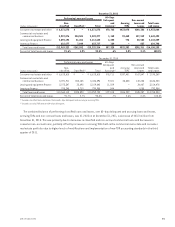
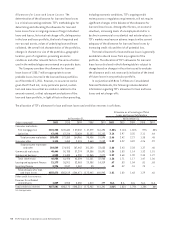
(In thousands) At December 31, 2011
Geographic Distribution:
Consumer
Real Estate
and Other Commercial
Leasing and
Equipment
Finance(1)
Inventory
Finance Total
Minnesota $2,750,344 $ 873,759 $ 91,258 $ 14,755 $ 3,730,116
Illinois 2,118,618 794,389 102,565 17,814 3,033,386
Michigan 924,252 671,296 124,583 16,484 1,736,615
Wisconsin 459,741 621,271 57,573 16,708 1,155,293
Colorado 574,569 104,749 42,950 4,093 726,361
California 2,395 17,505 395,319 18,176 433,395
Texas 209 2,549 248,477 32,171 283,406
Florida 3,694 55,592 167,160 29,358 255,804
Ohio 2,268 46,838 128,136 25,378 202,620
Indiana 23,417 101,912 58,945 15,653 199,927
New York 2,162 – 175,707 18,948 196,817
Canada – – 3,069 168,405 171,474
Arizona 53,461 33,702 73,983 5,992 167,138
Pennsylvania 57 – 137,162 23,579 160,798
Other 18,617 125,930 1,335,372 217,186 1,697,105
Total $6,933,804 $3,449,492 $3,142,259 $624,700 $14,150,255
(1) Excludes operating leases included in other assets.
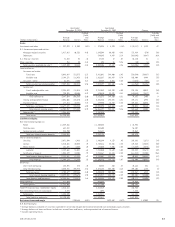
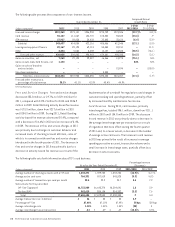
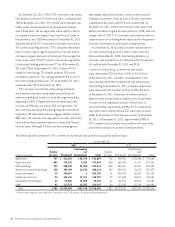
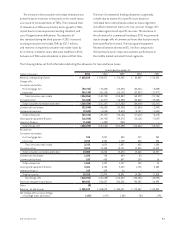
Loans and leases outstanding at December 31, 2011 are shown by contractual maturity in the following table.
At December 31, 2011(3)
(In thousands)
Consumer
Real Estate
and Other Commercial
Leasing and
Equipment
Finance(2)
Inventory
Finance Total
Amounts due:
Within 1 year $ 317,606 $ 613,488 $ 1,183,709 $624,700 $ 2,739,503
1 to 2 years 268,127 670,565 831,993 – 1,770,685
2 to 3 years 248,567 594,613 568,939 – 1,412,119
3 to 5 years 498,476 958,330 485,217 – 1,942,023
5 to 10 years 1,296,687 569,477 72,401 – 1,938,565
10 to 15 years 1,272,697 39,540 – – 1,312,237
Over 15 years 3,031,644 3,479 – – 3,035,123
Total after 1 year 6,616,198 2,836,004 1,958,550 – 11,410,752
Total $6,933,804 $3,449,492 $ 3,142,259 $624,700 $14,150,255
Amounts due after 1 year on:
Fixed-rate loans and leases $4,242,325 $1,657,383 $ 1,954,544 $ – $ 7,854,252
Variable- and adjustable-rate loans (1) 2,373,873 1,178,621 4,006 – 3,556,500
Total after 1 year $6,616,198 $2,836,004 $ 1,958,550 $ – $11,410,752
(1) Excludes fixed-term amounts under lines of credit which are included in closed-end loans.
(2) Excludes operating leases included in other assets.
(3) Gross of deferred fees and costs. This table does not include the effect of prepayments, which is an important consideration in management’s interest-rate risk analysis.
Company experience indicates that loans and leases remain outstanding for significantly shorter periods than their contractual terms.
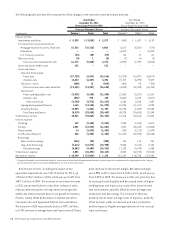
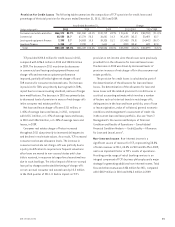
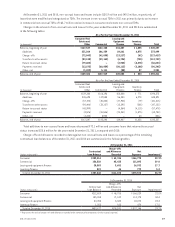
Retail Lending TCF’s consumer real estate loan
portfolio represents 48.7% of its total loan and lease
portfolio. The consumer real estate portfolio decreased
3.6% in 2011 and 1.7% in 2010. TCF’s consumer real estate
portfolio is secured by mortgages filed on residential real
estate. At December 31, 2011, 69% of loan balances were
secured by first mortgages with 31% secured by second
mortgages. The average loan size secured by a first
mortgage was $116 thousand and the average balance of
loans secured by a junior lien position was $37 thousand
at December 31, 2011. At December 31, 2011, 35% of the
consumer real estate portfolio carried a variable interest
rate tied to the prime rate, compared with 33% at
December 31, 2010.
312011 Form 10-K