TCF Bank 2011 Annual Report Download - page 45
Download and view the complete annual report
Please find page 45 of the 2011 TCF Bank annual report below. You can navigate through the pages in the report by either clicking on the pages listed below, or by using the keyword search tool below to find specific information within the annual report.-
 1
1 -
2
-
3
-
4
-
5
-
6
-
7
-
8
-
9
-
10
-
11
-
12
-
13
-
14
-
15
-
16
-
17
-
18
-
19
-
20
-
21
-
22
-
23
-
24
-
25
-
26
-
27
-
28
-
29
-
30
-
31
-
32
-
33
-
34
-
 35
35 -
 36
36 -
 37
37 -
 38
38 -
 39
39 -
 40
40 -
 41
41 -
 42
42 -
 43
43 -
 44
44 -
 45
45 -
 46
46 -
 47
47 -
 48
48 -
 49
49 -
 50
50 -
 51
51 -
 52
52 -
 53
53 -
 54
54 -
 55
55 -
56
-
57
-
58
-
59
-
60
-
61
-
62
-
63
-
64
-
65
-
66
-
67
-
68
-
69
-
70
-
71
-
72
-
73
-
74
-
75
-
76
-
77
-
78
-
79
-
80
-
81
-
82
-
83
-
84
-
85
-
86
-
87
-
88
-
89
-
90
-
91
-
92
-
93
-
94
-
95
-
96
-
97
-
98
-
99
-
100
-
101
-
102
-
103
-
104
-
105
-
106
-
107
-
108
-
109
-
110
-
111
-
112
-
113
-
114
-
115
-
116
-
117
-
118
-
119
-
120
-
121
-
122
-
123
-
124
-
125
-
126
-
127
-
128
-
129
-
130
-
131
-
132
-
133
-
134
-
135
-
136
-
137
-
138
-
139
-
140
 |
 |

The continued success of TCF’s debit card program is
highly dependent on the success and viability of Visa and the
continued use by customers and acceptance by merchants
of its cards. On June 29, 2011, the Federal Reserve issued its
final debit card interchange rule, establishing a debit card
interchange fee cap. These rules became effective October
1, 2011, and apply to issuers that, together with their
affiliates, have assets of $10 billion or more. Compared with
the fourth quarter of 2010, the average interchange rate per
transaction decreased slightly more than 50% during the
fourth quarter of 2011 and resulted in a reduction of TCF’s
interchange revenue of $14.7 million. See “Item 1A. Risk
Factors” for more information.
ATM Revenue ATM revenue totaled $27.9 million for 2011,
down from $29.8 million in 2010 and $30.4 million in 2009.
The declines in ATM revenue were primarily due to fewer fee
generating transactions and reduced ATM fleet.
Leasing and Equipment Finance Revenue Leasing
and equipment finance revenue in 2011 was relatively
flat compared with 2010. Leasing and equipment finance
revenues in 2010 increased $20.1 million, or 29%, from 2009.
The increase in 2010 from 2009 was primarily due to increased
operating lease revenue resulting from the acquisition
of Fidelity National Capital, Inc (“FNCI”) in 2009, which
also had a corresponding increase in operating lease
depreciation of $14.4 million in 2010.
Leasing and equipment finance revenues may fluctuate
from period to period based on customer-driven factors not
within TCF’s control.
Other Non-Interest Income Total other non-interest
income in 2011 decreased $2.2 million from 2010 compared
with an increase in 2010 of $345 thousand from 2009. The
decrease in 2011 from 2010 was primarily due to reduced
inventory finance inspection fees. The increase in 2010
from 2009 was primarily due to a gain on a non-marketable
investment of $538 thousand.
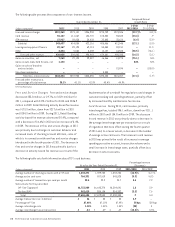
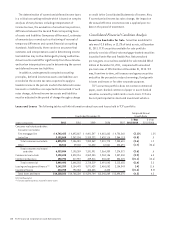
The following table presents the components of other non-interest income.
Year Ended December 31,
Compound Annual
Growth Rate
(Dollars in thousands) 2011 2010 2009 2008 2007
1-Year
2011/2010
5-Year
2011/2006
Investments and insurance $1,105 $1,111 $ 643 $ 9,405 $10,318 (.5)% (36.5)%
Gains on sales of education loans – – – 1,456 2,011 – (100.0)
Other 2,329 4,473 4,596 1,246 6,259 47.9 (30.5)
Total other earnings $3,434 $5,584 $5,239 $12,107 $18,588 (38.5) (36.1)
Gains on Securities, Net In 2011, TCF recognized gross gains of $8 million on sales of $522.5 million in mortgage-backed
securities and recognized other-than-temporary losses on certain investments of $768 thousand. In 2010, TCF recognized gross
gains of $31.5 million on sales of $1.3 billion in mortgage-backed securities and agency U.S. Treasury Bills and recognized
other-than-temporary losses on certain investments of $2.1 million. In 2009, TCF recognized gross gains of $31.9 million, on
sales of $2.1 billion of mortgage-backed securities and agency debentures and U.S. Treasury Bills and recognized other-than-
temporary losses on certain investments of $2 million.
Gains on Auto Loans Held for Sale, Net Following the acquisition of Gateway One on November 30, 2011, TCF sold
$37.4 million of auto loans and recognized $1.1 million in associated gains. TCF increased its portfolio of managed auto
assets, which include auto loans held for investment, auto loans held for sale and auto loans sold and serviced to $437.7
million at December 31, 2011.
272011 Form 10-K