TCF Bank 2011 Annual Report Download - page 115
Download and view the complete annual report
Please find page 115 of the 2011 TCF Bank annual report below. You can navigate through the pages in the report by either clicking on the pages listed below, or by using the keyword search tool below to find specific information within the annual report.-
 1
1 -
2
-
3
-
4
-
5
-
6
-
7
-
8
-
9
-
10
-
11
-
12
-
13
-
14
-
15
-
16
-
17
-
18
-
19
-
20
-
21
-
22
-
23
-
24
-
25
-
26
-
27
-
28
-
29
-
30
-
31
-
32
-
33
-
34
-
35
-
36
-
37
-
38
-
39
-
40
-
41
-
42
-
43
-
44
-
45
-
46
-
47
-
48
-
49
-
50
-
51
-
52
-
53
-
54
-
55
-
56
-
57
-
58
-
59
-
60
-
61
-
62
-
63
-
64
-
65
-
66
-
67
-
68
-
69
-
70
-
71
-
72
-
73
-
74
-
75
-
76
-
77
-
78
-
79
-
80
-
81
-
82
-
83
-
84
-
85
-
86
-
87
-
88
-
89
-
90
-
91
-
92
-
93
-
94
-
95
-
96
-
97
-
98
-
99
-
100
-
101
-
102
-
103
-
104
-
 105
105 -
 106
106 -
 107
107 -
 108
108 -
 109
109 -
 110
110 -
 111
111 -
 112
112 -
 113
113 -
 114
114 -
 115
115 -
 116
116 -
 117
117 -
 118
118 -
 119
119 -
 120
120 -
 121
121 -
 122
122 -
 123
123 -
 124
124 -
 125
125 -
126
-
127
-
128
-
129
-
130
-
131
-
132
-
133
-
134
-
135
-
136
-
137
-
138
-
139
-
140
 |
 |

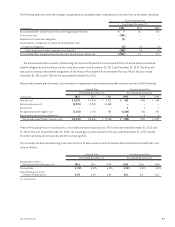
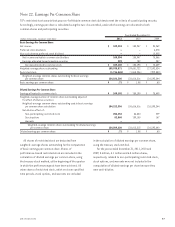
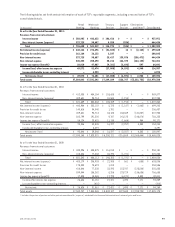
Note 22. Earnings Per Common Share
TCF’s restricted stock awards that pay non-forfeitable common stock dividends meet the criteria of a participating security.
Accordingly, earnings per share is calculated using the two-class method, under which earnings are allocated to both
common shares and participating securities.
Year Ended December 31,
(Dollars in thousands, except per-share data) 2011 2010 2009
Basic Earnings Per Common Share
Net income $ 109,394 $ 150,947 $ 94,269
Preferred stock dividends – – 6,378
Non-cash deemed preferred stock dividend – – 12,025
Net income available to common stockholders 109,394 150,947 75,866
Earnings allocated to participating securities 292 752 257
Earnings allocated to common stock $ 109,102 $ 150,195 $ 75,609
Weighted-average share outstanding 155,938,871 139,681,722 127,592,824
Restricted stock (1,716,565) (1,065,206) (999,580)
Weighted-average common shares outstanding for basic earnings
per common share 154,222,306 138,616,516 126,593,244
Basic earnings per common share $ .71 $ 1.08 $ .60
Diluted Earnings Per Common Share
Earnings allocated to common stock $ 109,102 $ 150,195 $ 75,609
Weighted-average number of common share outstanding adjusted
for effect of dilutive securities:
Weighted-average common shares outstanding used in basic earnings
per common share calculation 154,222,306 138,616,516 126,593,244
Net dilutive effect of:
Non-participating restricted stock 204,354 56,844 229
Stock options 82,560 139,155 167
Warrants – – –
Weighted-average common shares outstanding for diluted earnings
per common share 154,509,220 138,812,515 126,593,640
Diluted earnings per common share $ .71 $ 1.08 $ .60
All shares of restricted stock are deducted from
weighted-average shares outstanding for the computation
of basic earnings per common share. Shares of
performance-based restricted stock are included in the
calculation of diluted earnings per common share, using
the treasury stock method, at the beginning of the quarter
in which the performance goals have been achieved. All
other shares of restricted stock, which vest over specified
time periods, stock options, and warrants are included
in the calculation of diluted earnings per common share,
using the treasury stock method.
For the years ended December 31, 2011, 2010 and
2009, 5 million, 4.1 million and 6.5 million shares,
respectively, related to non-participating restricted stock,
stock options, and warrants were not included in the
computation of diluted earnings per share because they
were anti-dilutive.
972011 Form 10-K