TCF Bank 2011 Annual Report Download - page 43
Download and view the complete annual report
Please find page 43 of the 2011 TCF Bank annual report below. You can navigate through the pages in the report by either clicking on the pages listed below, or by using the keyword search tool below to find specific information within the annual report.-
 1
1 -
2
-
3
-
4
-
5
-
6
-
7
-
8
-
9
-
10
-
11
-
12
-
13
-
14
-
15
-
16
-
17
-
18
-
19
-
20
-
21
-
22
-
23
-
24
-
25
-
26
-
27
-
28
-
29
-
30
-
31
-
32
-
 33
33 -
 34
34 -
 35
35 -
 36
36 -
 37
37 -
 38
38 -
 39
39 -
 40
40 -
 41
41 -
 42
42 -
 43
43 -
 44
44 -
 45
45 -
 46
46 -
 47
47 -
 48
48 -
 49
49 -
 50
50 -
 51
51 -
 52
52 -
 53
53 -
54
-
55
-
56
-
57
-
58
-
59
-
60
-
61
-
62
-
63
-
64
-
65
-
66
-
67
-
68
-
69
-
70
-
71
-
72
-
73
-
74
-
75
-
76
-
77
-
78
-
79
-
80
-
81
-
82
-
83
-
84
-
85
-
86
-
87
-
88
-
89
-
90
-
91
-
92
-
93
-
94
-
95
-
96
-
97
-
98
-
99
-
100
-
101
-
102
-
103
-
104
-
105
-
106
-
107
-
108
-
109
-
110
-
111
-
112
-
113
-
114
-
115
-
116
-
117
-
118
-
119
-
120
-
121
-
122
-
123
-
124
-
125
-
126
-
127
-
128
-
129
-
130
-
131
-
132
-
133
-
134
-
135
-
136
-
137
-
138
-
139
-
140
 |
 |

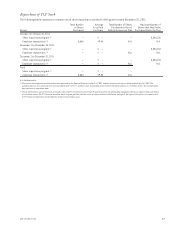
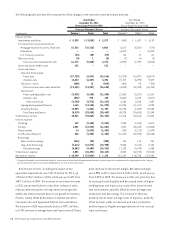
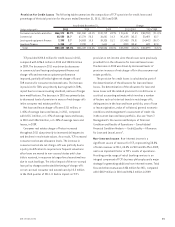
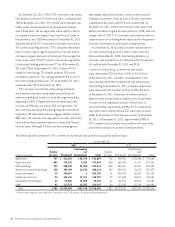
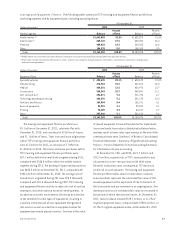
Provision for Credit Losses The following table summarizes the composition of TCF’s provision for credit losses and
percentage of the total provision for the years ended December 31, 2011, 2010 and 2009.
Year Ended December 31, Change
(Dollars in thousands) 2011 2010 2009 2011/2010 2010/2009
Consumer real estate and other $166,575 82.9% $141,960 60.1% $180,719 69.9% $ 24,615 17.3% $(38,759) (21.4)%
Commercial 25,555 12.7 67,374 28.5 36,881 14.3 (41,819) (62.1) 30,493 82.7
Leasing and equipment finance 7,395 3.7 24,883 10.5 39,325 15.2 (17,488) (70.3) (14,442) (36.7)
Inventory finance 1,318 .7 2,220 .9 1,611 .6 (902) (40.6) 609 37.8
Total $200,843 100.0% $236,437 100.0% $258,536 100.0% $(35,594) (15.1)% $(22,099) (8.5)%
TCF provided $200.8 million for credit losses in 2011,
compared with $236.4 million in 2010 and $258.5 million
in 2009. The decrease in 2011 was driven by decreases
in commercial and leasing and equipment finance net
charge-offs and reserves as customer performance
improved, partially offset by higher net charge-offs and
TDR reserves for consumer real estate loans. The increase
in provision for TDRs was primarily due to growth in TDRs,
in part due to a new accounting standard, and use of longer
term modifications. The decrease in 2010 was primarily due
to decreased levels of provision in excess of net charge-offs
in the consumer real estate portfolio.
Net loan and lease charge-offs were $211 million, or
1.45% of average loans and leases, in 2011, compared
with $215.1 million, or 1.47% of average loans and leases,
in 2010 and $186.5 million, or 1.34% of average loans and
leases, in 2009.
Consumer real estate charge-off rates increased
throughout 2011 due primarily to increased delinquencies
and declines in real estate values. As a result, TCF increased
consumer real estate allowance levels. The increase in
consumer real estate net charge-offs was partially due to
a policy modification to require more frequent valuations
after loans are moved to non-accrual status until clear
title is received, in response to longer foreclosure timelines
due to court backlogs. The initial impact of the non-accrual
loan policy change accelerated the timing of charge-offs
on non-accrual consumer real estate loans by $2.2 million
in the third quarter of 2011. It had no impact on TCF’s
provision or net income since these losses were previously
provided for in the allowance for loan and lease losses.
The decrease in 2010 was driven by decreased levels of
provision in excess of net charge-offs in the consumer real
estate portfolio.
The provision for credit losses is calculated as part of
the determination of the allowance for loan and lease
losses. The determination of the allowance for loan and
lease losses and the related provision for credit losses is
a critical accounting estimate which involves a number
of factors such as historical trends in net charge-offs,
delinquencies in the loan and lease portfolio, year of loan
or lease origination, value of collateral, general economic
conditions and management’s assessment of credit risk
in the current loan and lease portfolio. Also see “Item 7.
Management’s Discussion and Analysis of Financial
Condition and Results of Operations — Consolidated
Financial Condition Analysis — Credit Quality — Allowance
for Loan and Lease Losses”.
Non-Interest Income Non-interest income is a
significant source of revenue for TCF, representing 38.8%
of total revenues in 2011, 43.5% in 2010 and 45.4% in 2009,
and is an important factor in TCF’s results of operations.
Providing a wide range of retail banking services is an
integral component of TCF’s business philosophy and a major
strategy for generating additional non-interest income. Total
fees and other revenue was $436 million for 2011, compared
with $508.9 million in 2010 and $496.5 million in 2009.
252011 Form 10-K